Looking at the current return on capital profiles for the GCC countries, a few things become abundantly clear: 1) overall GCC aggregate return on capital (7.5%) is now firmly below the blended cost of capital (7.7%), suggesting that based on the latest quarter performance, the GCC in aggregate is generating negative economic value-added, 2) with the lone exception of Kuwait, all individual market aggregate ROCs are below their cost of capital hurdle rates (Kuwait is an outlier in that less profitable SOE or sovereign-linked companies do not dominate the total market capitalization) and 3) this is despite very low corporate tax rates for most of the GCC (KSA is the exception here) – which if normalized to global averages (e.g. 35%) would push historical (15-yr) average ROCs for virtually every country to well below their cost of capital hurdles (see Chart 1 below where we modeled return profiles by country and sector groupings based on 25% and 35% corporate tax rates).
SOE dominance in most GCC stock markets and the resulting crowding-out of the private sector, is a key driver for these low returns in our opinion. For every positive EVA private sector company (e.g. an Aramex, Humansoft or Jarir), their collective economic value added is overwhelmed by the massive value destruction of giant SOEs like SABIC, Industries Qatar, Etihad Airways or even Emirates Airlines (see our 2019 post on GCC Airlines: https://www.linkedin.com/pulse/middle-east-airlines-strategic-diversifiers-serial-capital-zuaiter). In a structurally low oil price environment, where government revenues are challenged and economic growth sharply contracts, shouldn’t the path to value creation lie in aggressively growing the private sector?
Chart 1: GCC Summary of Returns on Capital (Aggregate, By Country, Financials & Non-Financials) – Latest Quarter & 15-Year Averages
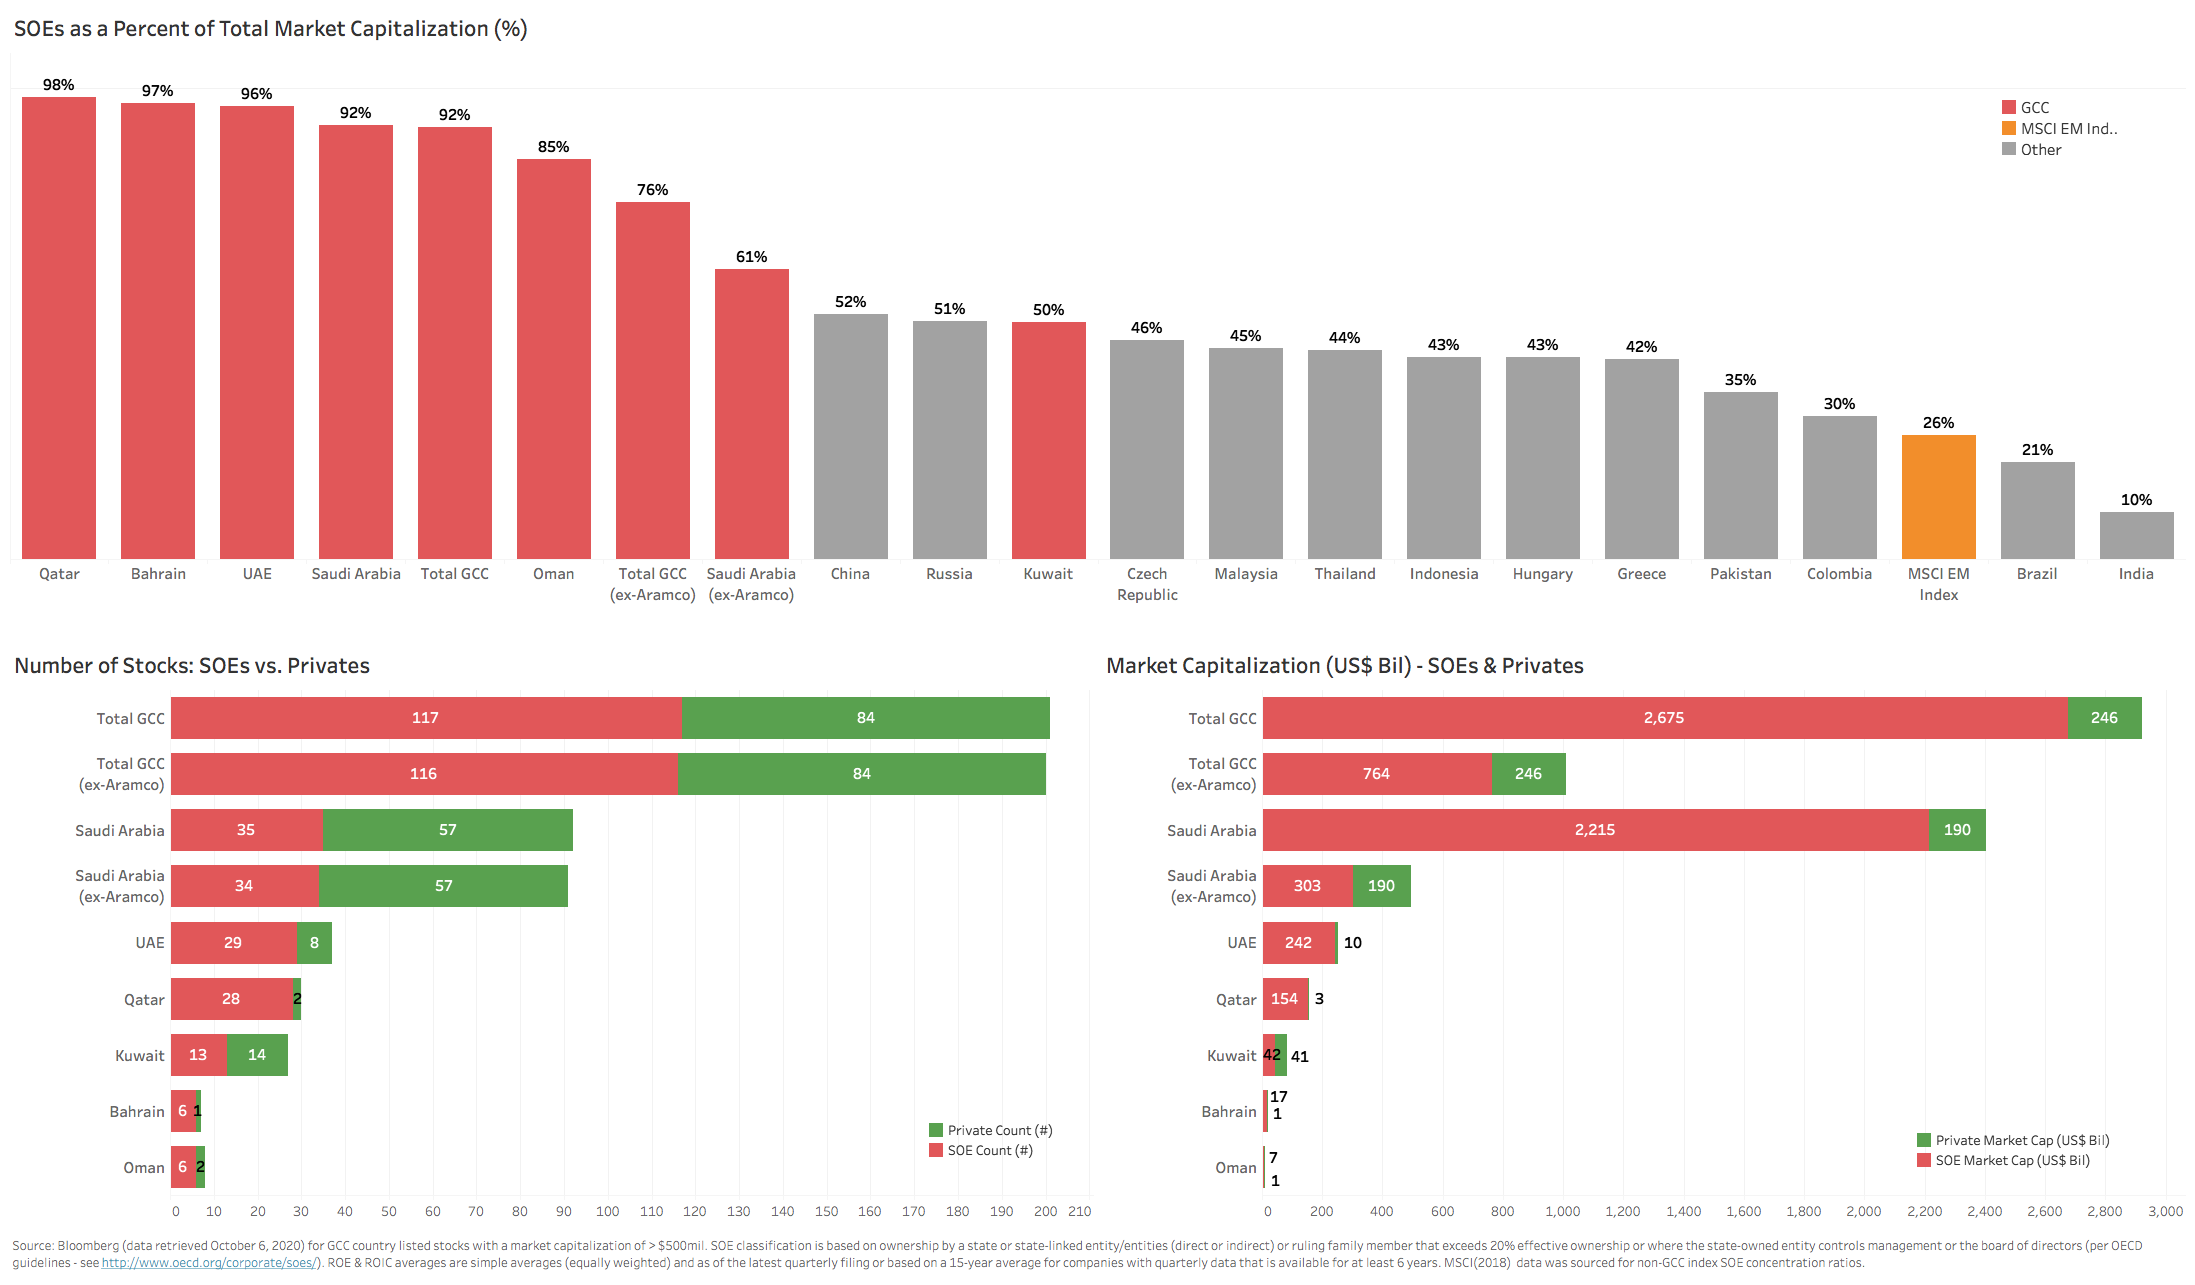
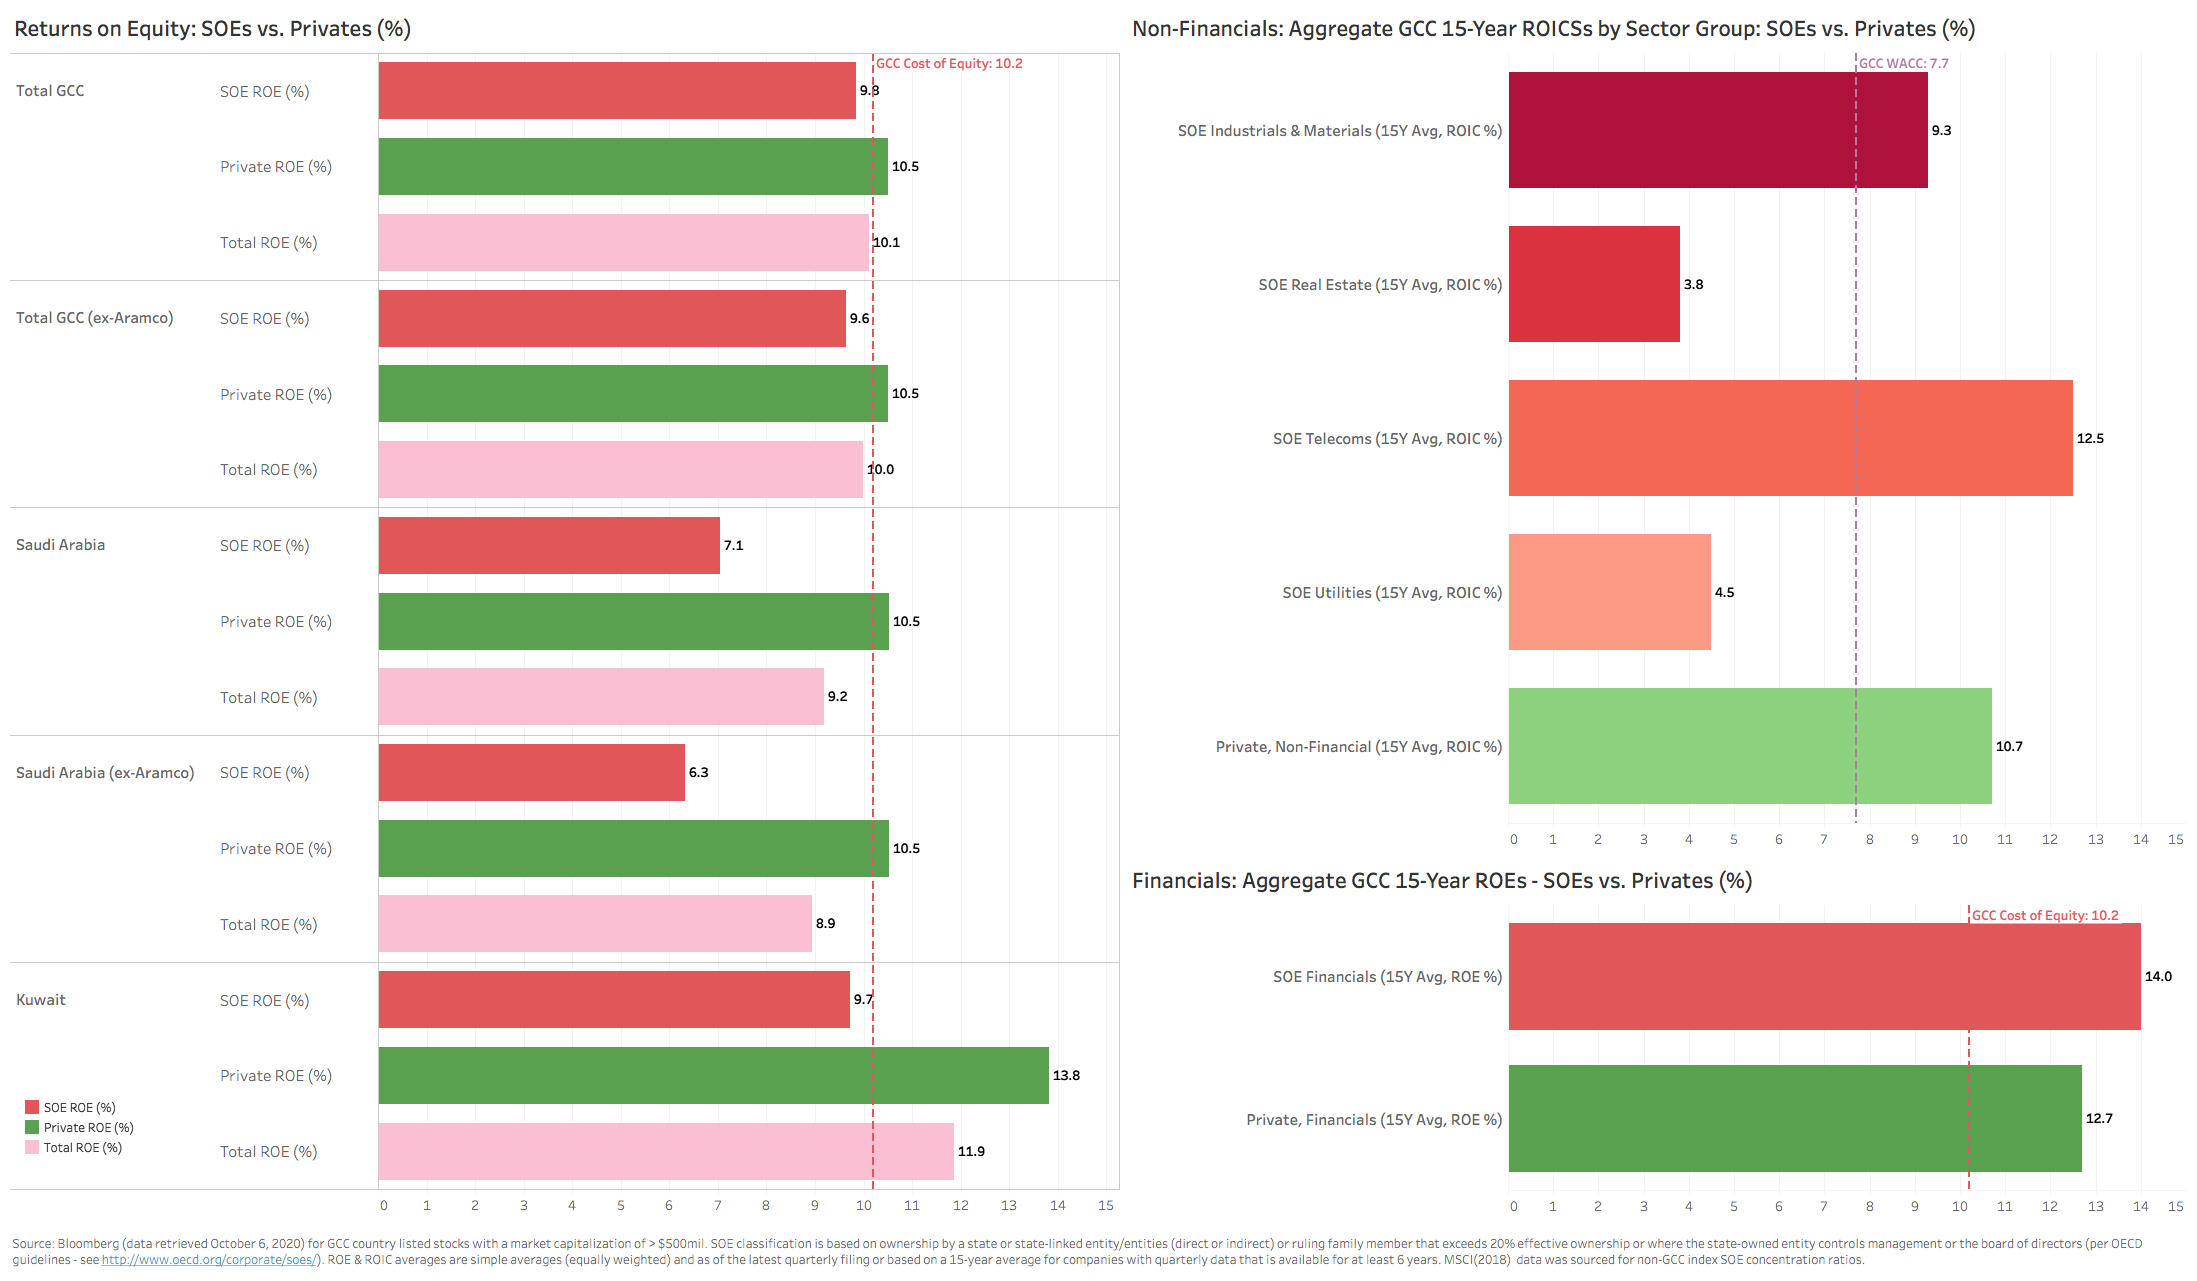
GCC stock markets continue to be huge outliers in an emerging markets context in terms of the weight of SOEs (state-owned entities) in their stock market capitalizations. For example, SOE weights in Russia (51%) and even China (52%) pale in comparison to the likes of the UAE (96%) and Qatar (98%) – see Chart 2 below. Saudi Arabia is a bit more balanced if Aramco is excluded (62%), with its total SOE weight rising to 92% with Aramco’s addition. Kuwait is the most balanced market with a 50/50 split between SOE and private. The smaller markets (Oman, Bahrain) have only three stocks between them that are non-SOE owned, while even the larger Qatari market can only claim 3 credible non-SOE stocks. Those markets with a large enough sample of private names (Saudi and Kuwait) show the large divergence in returns on capital between private and SOE groupings, with ROE premiums for the privates ranging from 200bps to 300bps; in both cases, privates handily outperform the overall country ROE average.
Chart 2: GCC SOE Concentration
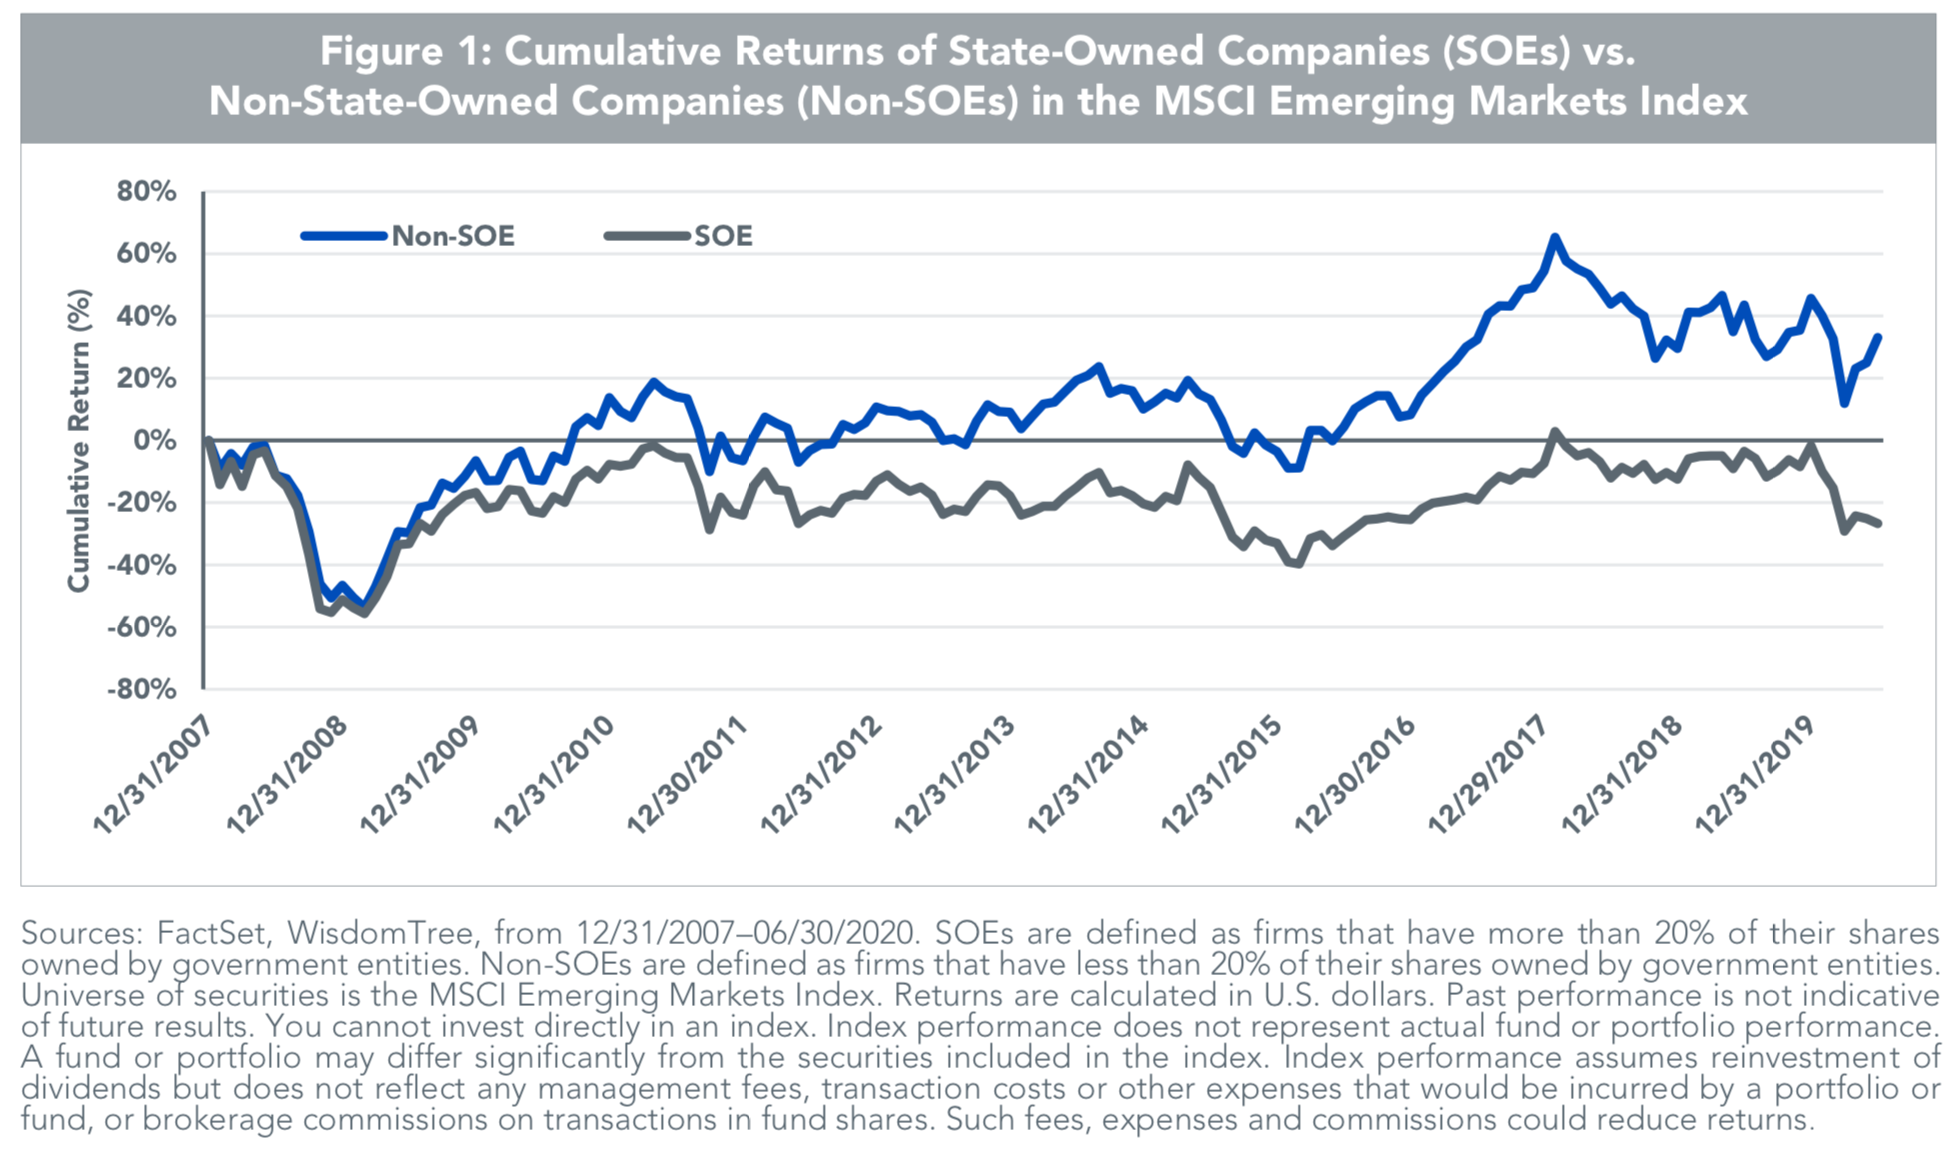
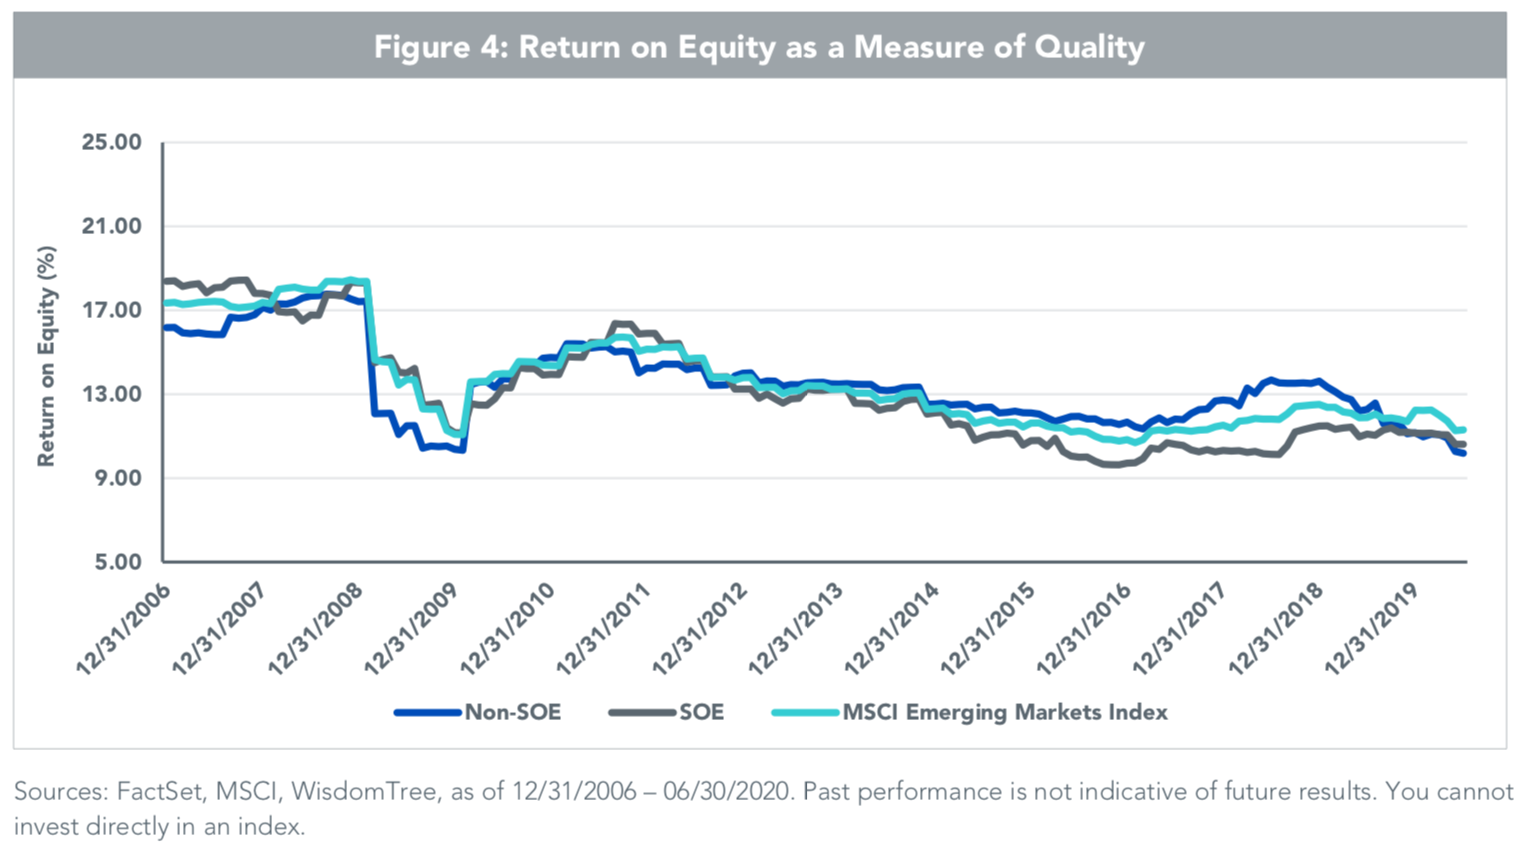
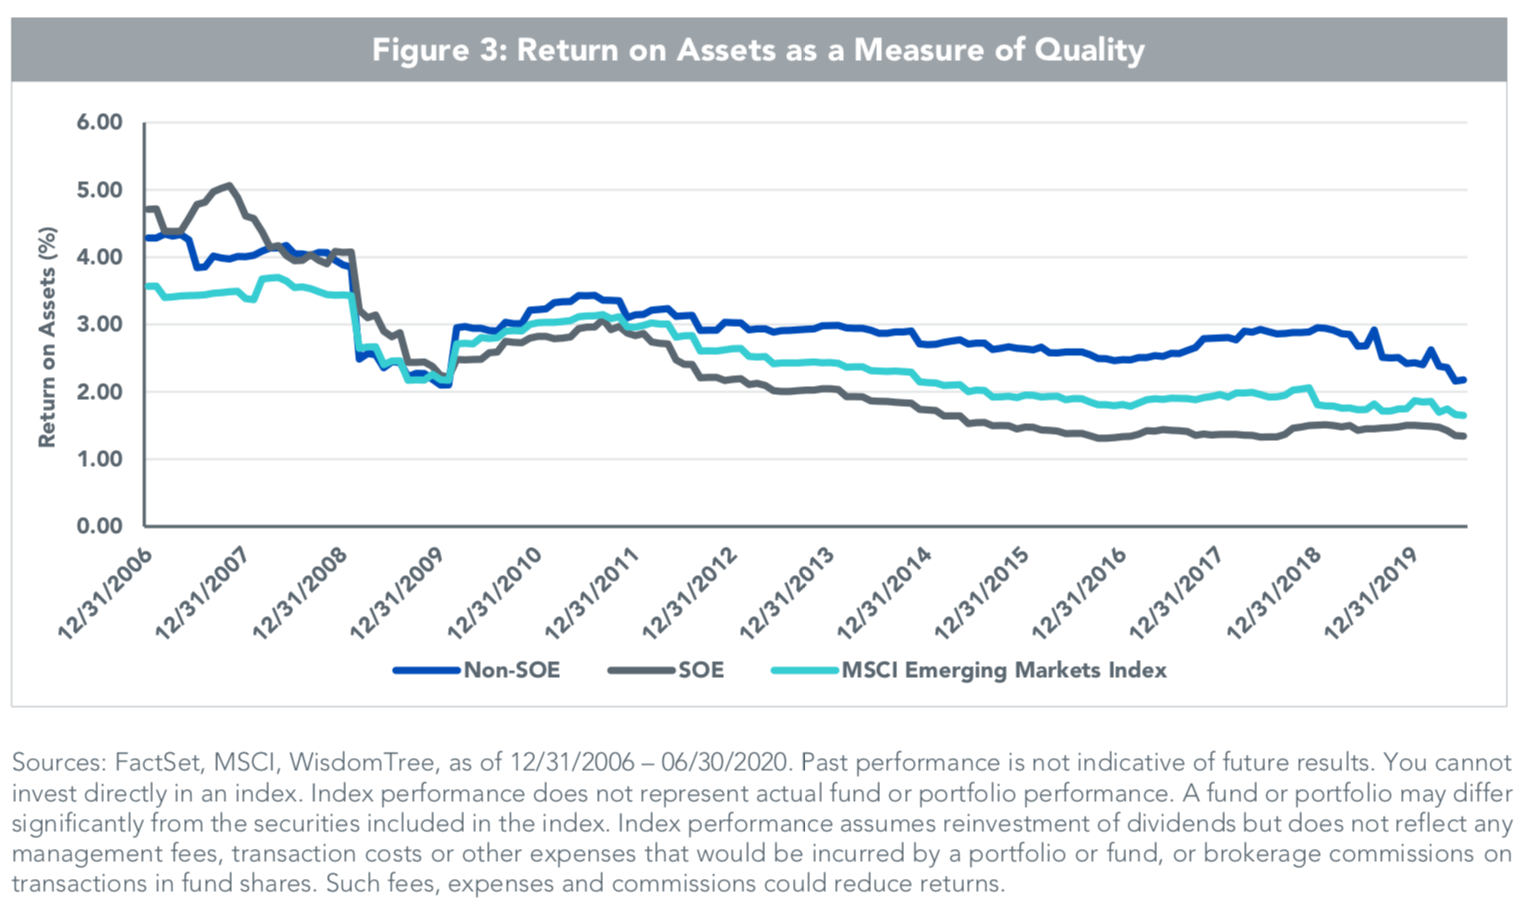
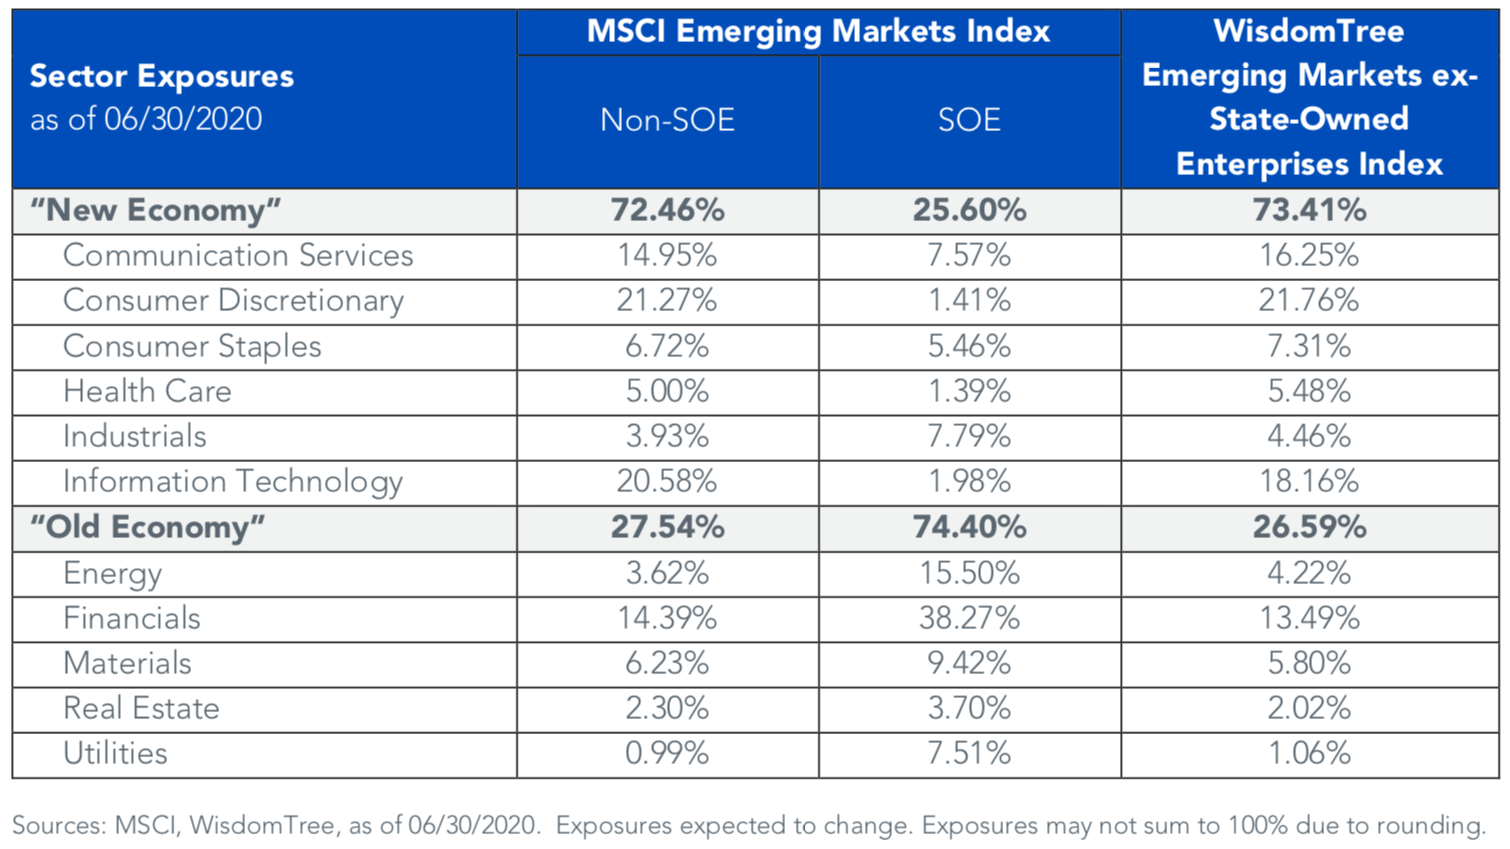
With 4/6 GCC countries having made their way into the MSCI EM Index of late (Kuwait joins next month), it is worthwhile looking at how emerging market SOEs have fared relative to their private-sector cohorts over the past decade. WisdomTree (an ETF provider with a $2.2 billion ex-SOE ETF for emerging markets) has shed some light on this phenomenon. Data from WisdomTree suggests a meaningful underperformance of returns for EM SOE names on a 5- & 10-year historical basis (500-700bps; see Charts 3-5 below). For context, SOEs make up roughly 26% of the MSCI Emerging Markets Index (as of December 2018). This concentration level is most likely higher in 2020 post the March 2019 inclusion of the China A-Shares to the index, which elevated China SOEs to nearly 15% of the MSCI EM Index (according to Callan – see: https://www.callan.com/em-soe/).
The driver for this underperformance is somewhat intuitive in our opinion. SOEs by definition introduce a clear misalignment of interests (both strategic and financial) between those of the state and the interests of minority shareholders. This in turn not only introduces a critical agency problem through elevated governance risks, but also has empirically led to poor allocation of capital. State incentives tend to favor the maximization of social or political benefits (e.g. absorbing excess labor, sponsoring public-sector projects, keeping staple product prices affordable, etc.) vs. maximizing overall stakeholder value. SOEs also tend to suffer from state-enabled managerial entrenchment and lack of accountability to a wider governance base, which results in a far less aligned and incentivized management. This tends to mirror the autocratic and top-down, command-oriented political frameworks of the host governments. As a consequence, SOE company managers are undeterred in over-investing or ’empire building’. Finally, in countries where the banking system is also SOE-dominated, SOEs tend to benefit disproportionately from concessional debt terms, preferential bank loan financing and thus a substantially subsidized cost of capital. This ends up crowding out the private sector from all forms of capital and resources.
The commonly cited counter argument is that SOE involvement/influence may in fact reduce the risk profile of the company (explicit sovereign backing, funder of last resort, or a protected moat in terms of tightly regulated competition- banks and telcos are the obvious examples here). But as ever, with a lower risk profile and a subsidized cost of capital, returns on capital tend to eventually fall in tandem while operational efficiency and capital productivity suffer. This negative impact on profitability and capital efficiency is compounded in countries where a legacy socialist culture/framework still lingers and SOEs are viewed as instruments of the state for interventions in the market mechanism (for social, political, or economic objectives) or even a lever to control key elements of society.
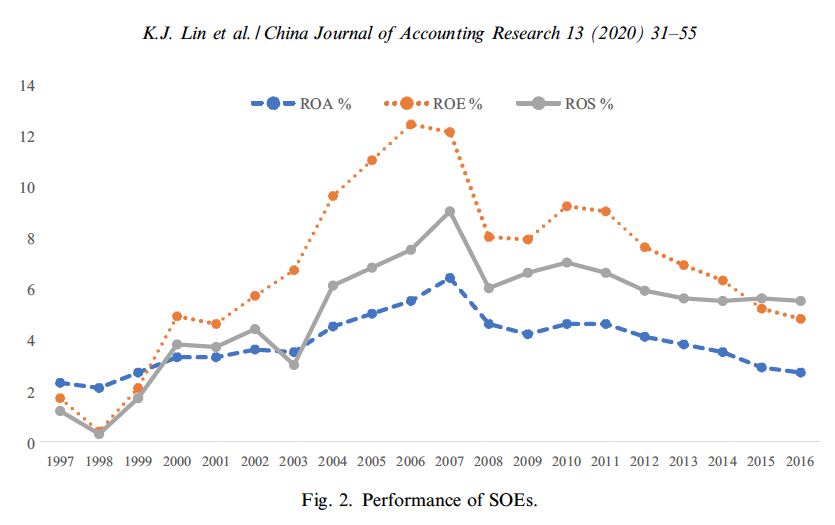
China is a prime example of where SOE dominance over several decades has structurally impacted overall returns on capital. Despite the obvious benefits that SOE dominance has provided the state (China’s exceptionally high GDP growth rates are no doubt a big positive dividend), returns on capital for at least the SOE sector in China’s stock market (52% of total market capitalization) have de-rated markedly since they peaked in 2006 (Chart 6 below). This is also despite the raft of key reforms to the SOE sector in the past 4 decades (see: https://www.researchgate.net/publication/339293581_State-owned_enterprises_in_China_A_review_of_40_years_of_research_and_practice). The authors of this report do a fantastic job of describing this reform journey, but come up well short of coherently rationalizing how the Chinese SOE dominance is in fact a contributor to China’s productivity-led growth phenomenon, especially during the last decade.
Chart 6: Chinese SOEs – Historical Returns on Capital (1997-2016)
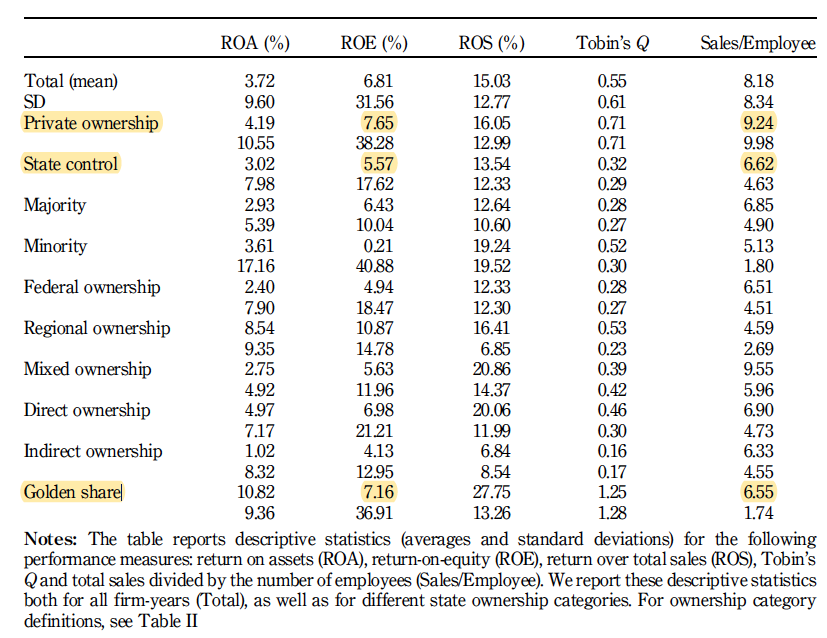
Russia is also a good analog for the GCC that is worth consideration. A 2019 report on Russian SOEs (https://www.emerald.com/insight/content/doi/10.1108/IJOEM-08-2017-0287/full/html) echoes much of the negative performance effects witnessed in China, but finds meaningful differences in performance relating to varying forms of state ownership. The study found that the relationship between state ownership and profitability amongst Russian firms becomes positive in sectors where state firms enjoy lower competition (e.g. extractive industries and highly regulated sectors where monopolistic tendencies are most prevalent or where barriers to entry are highest). They also found that state control through golden shares (as opposed to outright majority ownership or board/management control) typically results in better performance vs. other SOEs (see Chart 7 below).
Most interestingly, the authors found that despite the better performance of ‘protected’ or ‘golden share’ Russian SOEs, neither grouping’s higher profitability ended up translating into higher valuation ratings during this period. This makes sense to us, since in most integrated financial markets where minority foreign investors play a disproportionately larger impact in influencing valuations (they tend to be the marginal buyers), the cloud of poor governance tends to overwhelm even the reality of superior profitability. This seems to be the case for most EM SOE valuations (i.e. discounts to their market averages) we have looked at and is especially noteworthy for highly regulated/protected sectors where SOE dividend yields tend to be higher than the market average. This has important implications for several GCC SOE sector groupings (banks and telcos) discussed below.
Chart 7: Russia’s SOE vs. Private Returns on Capital (2011-2015)
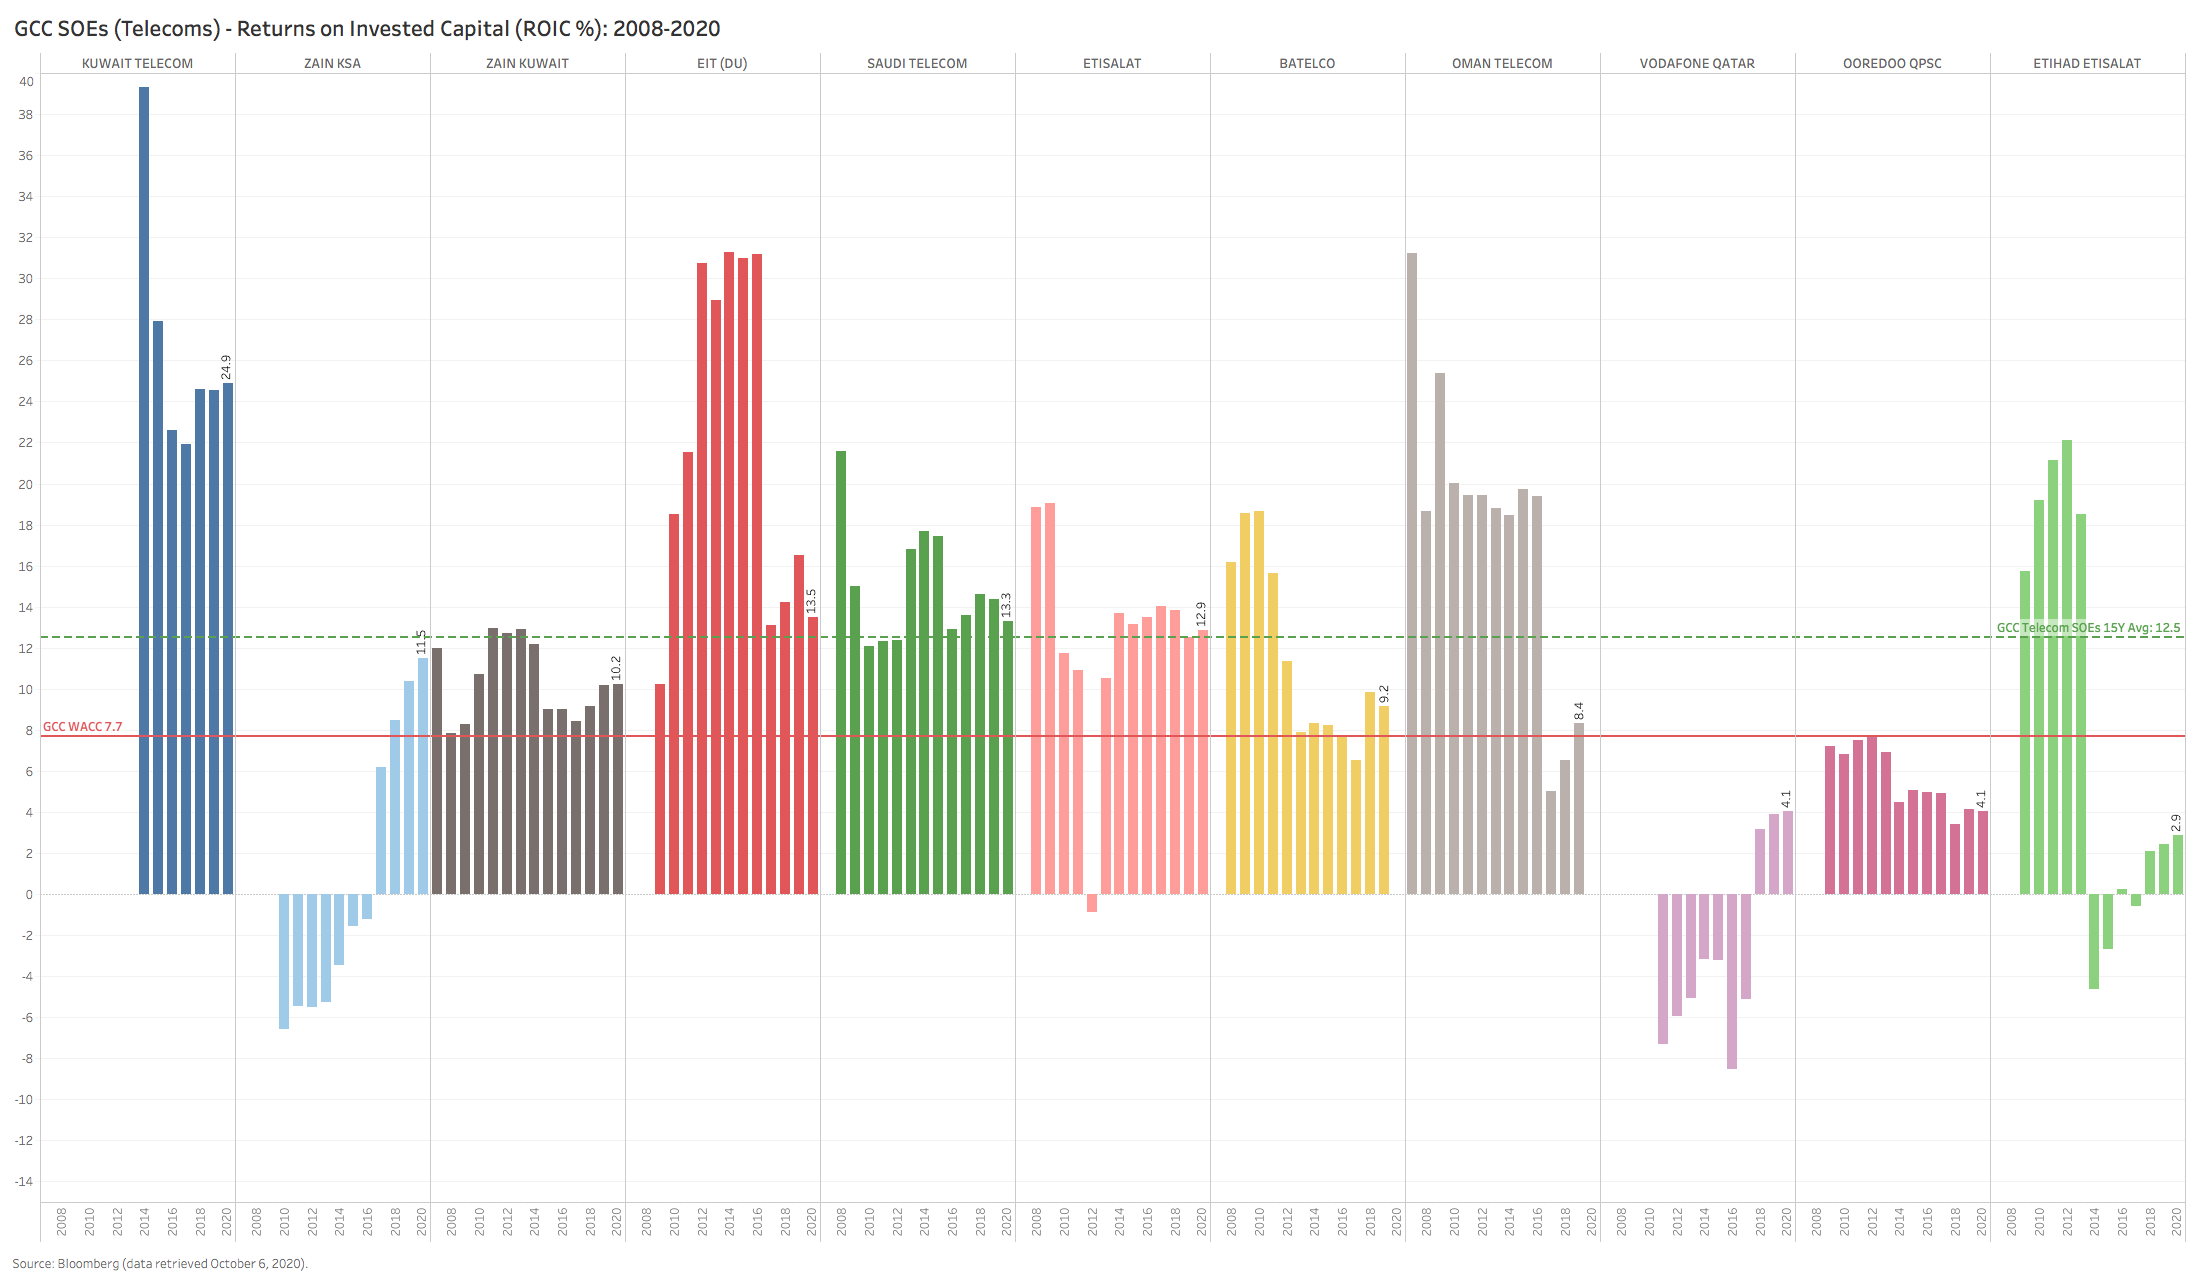
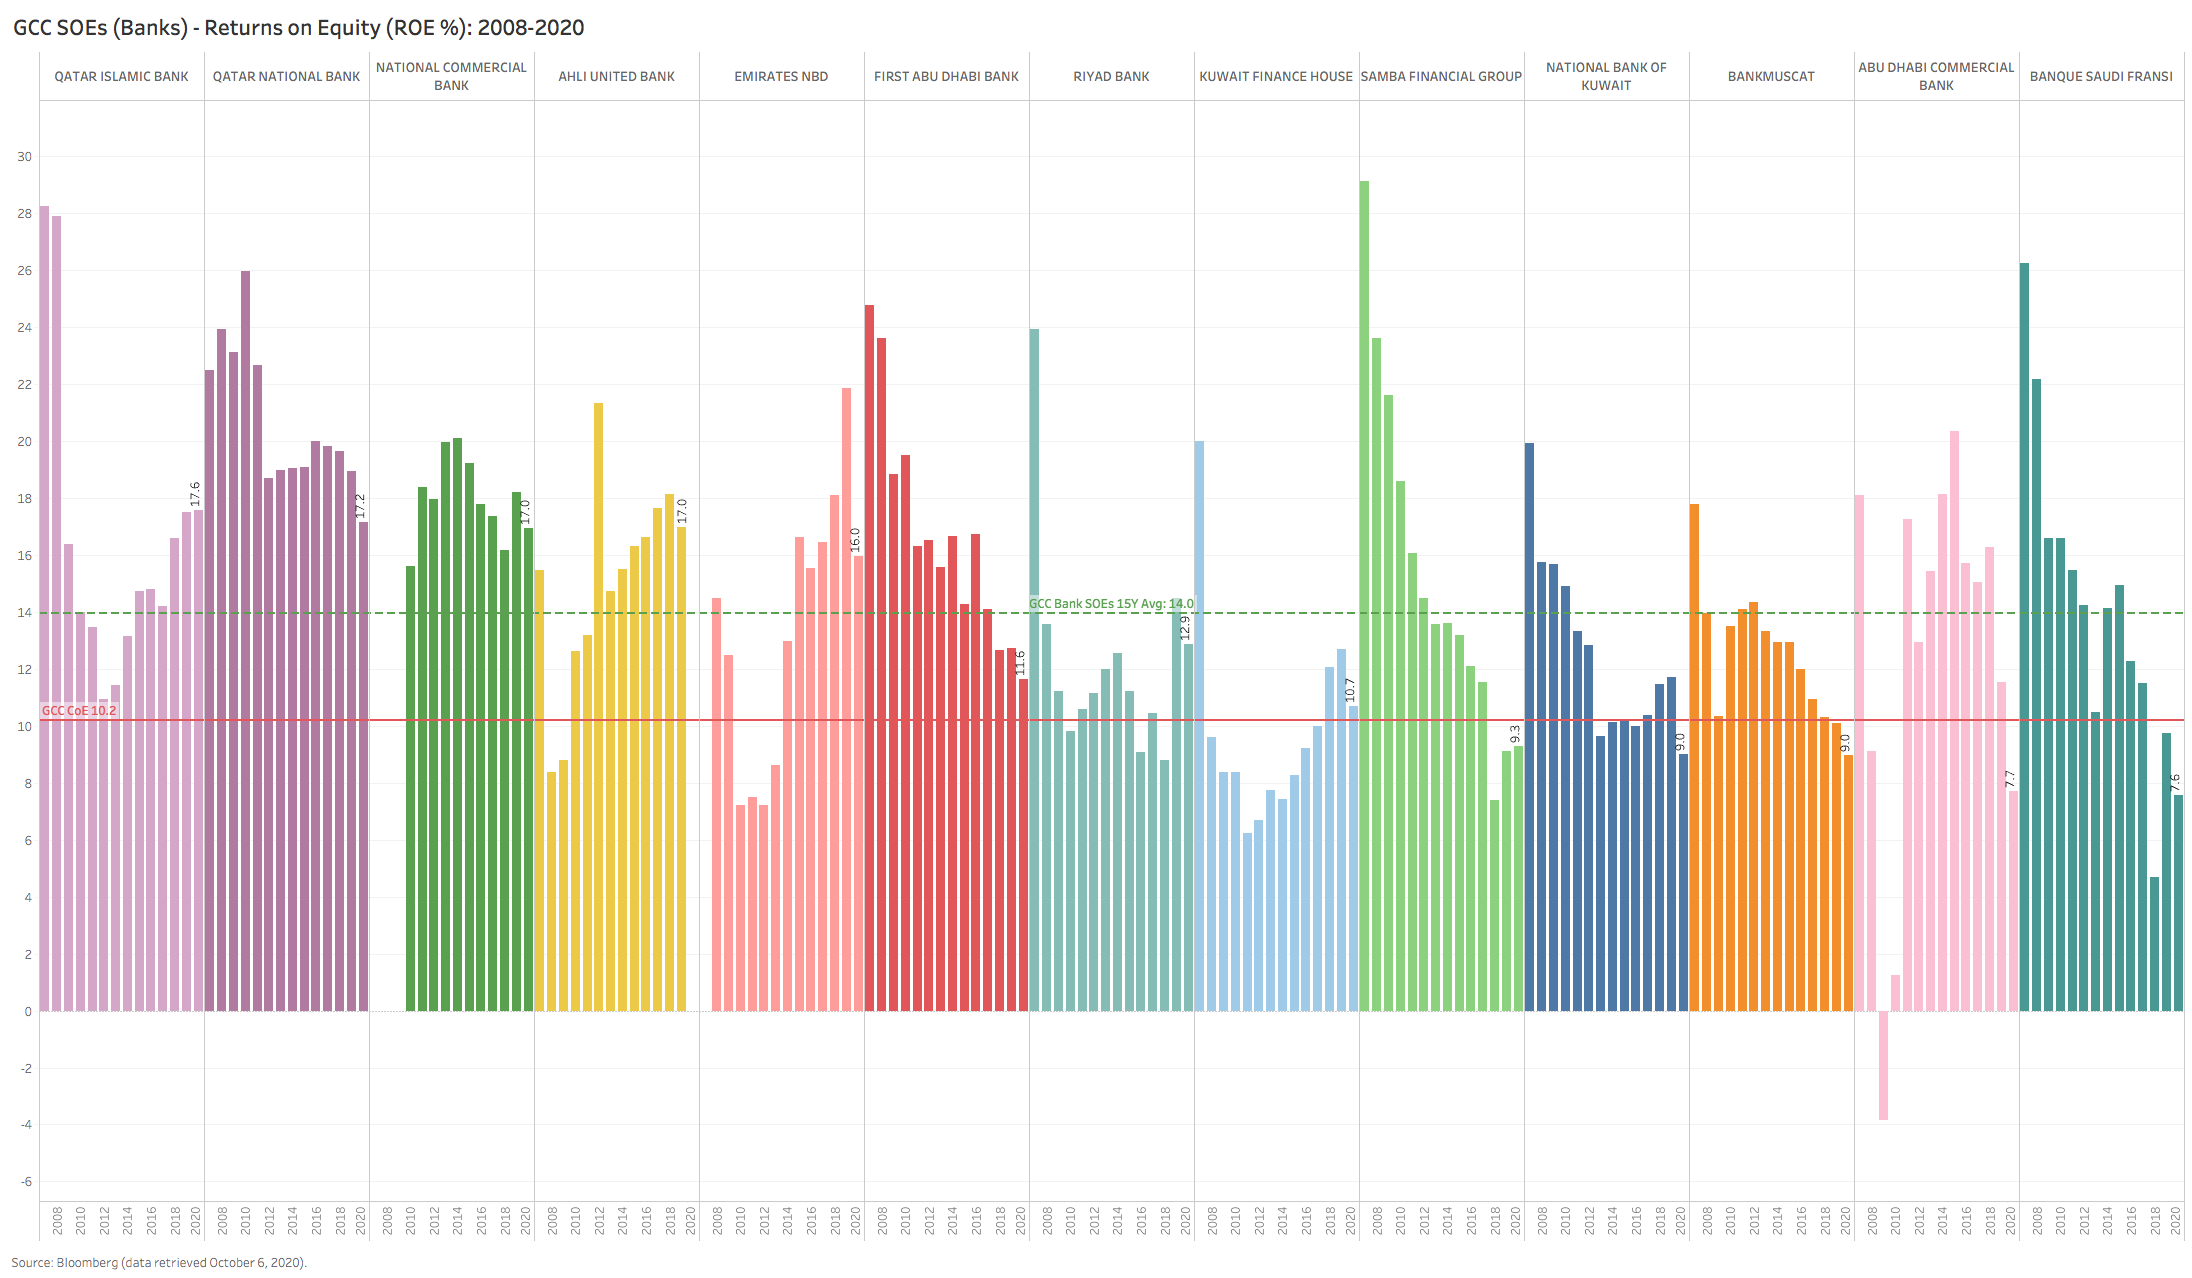
Back to the GCC. Even though returns for GCC SOEs trail those of private sector companies, the overall average and the blended cost of capital (Chart 8 below), two large SOE sectors have in fact outperformed their private counterparts and have generated positive EVA – at least on a 15-year historical basis. GCC SOE telecoms and banks have historically generated returns on capital in excess of their cost of capital, however recent trends (the past 5 years) suggest that this positive EVA profile may in fact be weakening.
For SOE telecoms, one can argue that the regulatory protection of the legacy SOE providers is gradually being eroded by both highly disruptive competing technologies (many of which emanate from outside their national borders) and falling incremental profitability of legacy telecom services (incremental ROIC trends for 8/10 SOE telcos are falling – see Chart 12 below). With telecom volumes expected to fall in several countries due to shrinking migrant populations and lower subscriber usage, the prospect of negative operating leverage for such a capital intensive model is daunting.
For SOE banks, the same disruptive challenge is manifesting itself via the emergence of FinTechs that are gradually dis-intermediating transaction revenues (e.g. via mobile payments), while net interest margins on the legacy lending business are in decline due to structurally low US$-linked interest rates (5/6 GCC currencies are pegged to the US$). As a result, like with the telcos, despite the majority of banks generating positive EVA in 2019/20, ten of the thirteen banks profiled (see Chart 13 below) are exhibiting falling ROEs over the past 5 years.
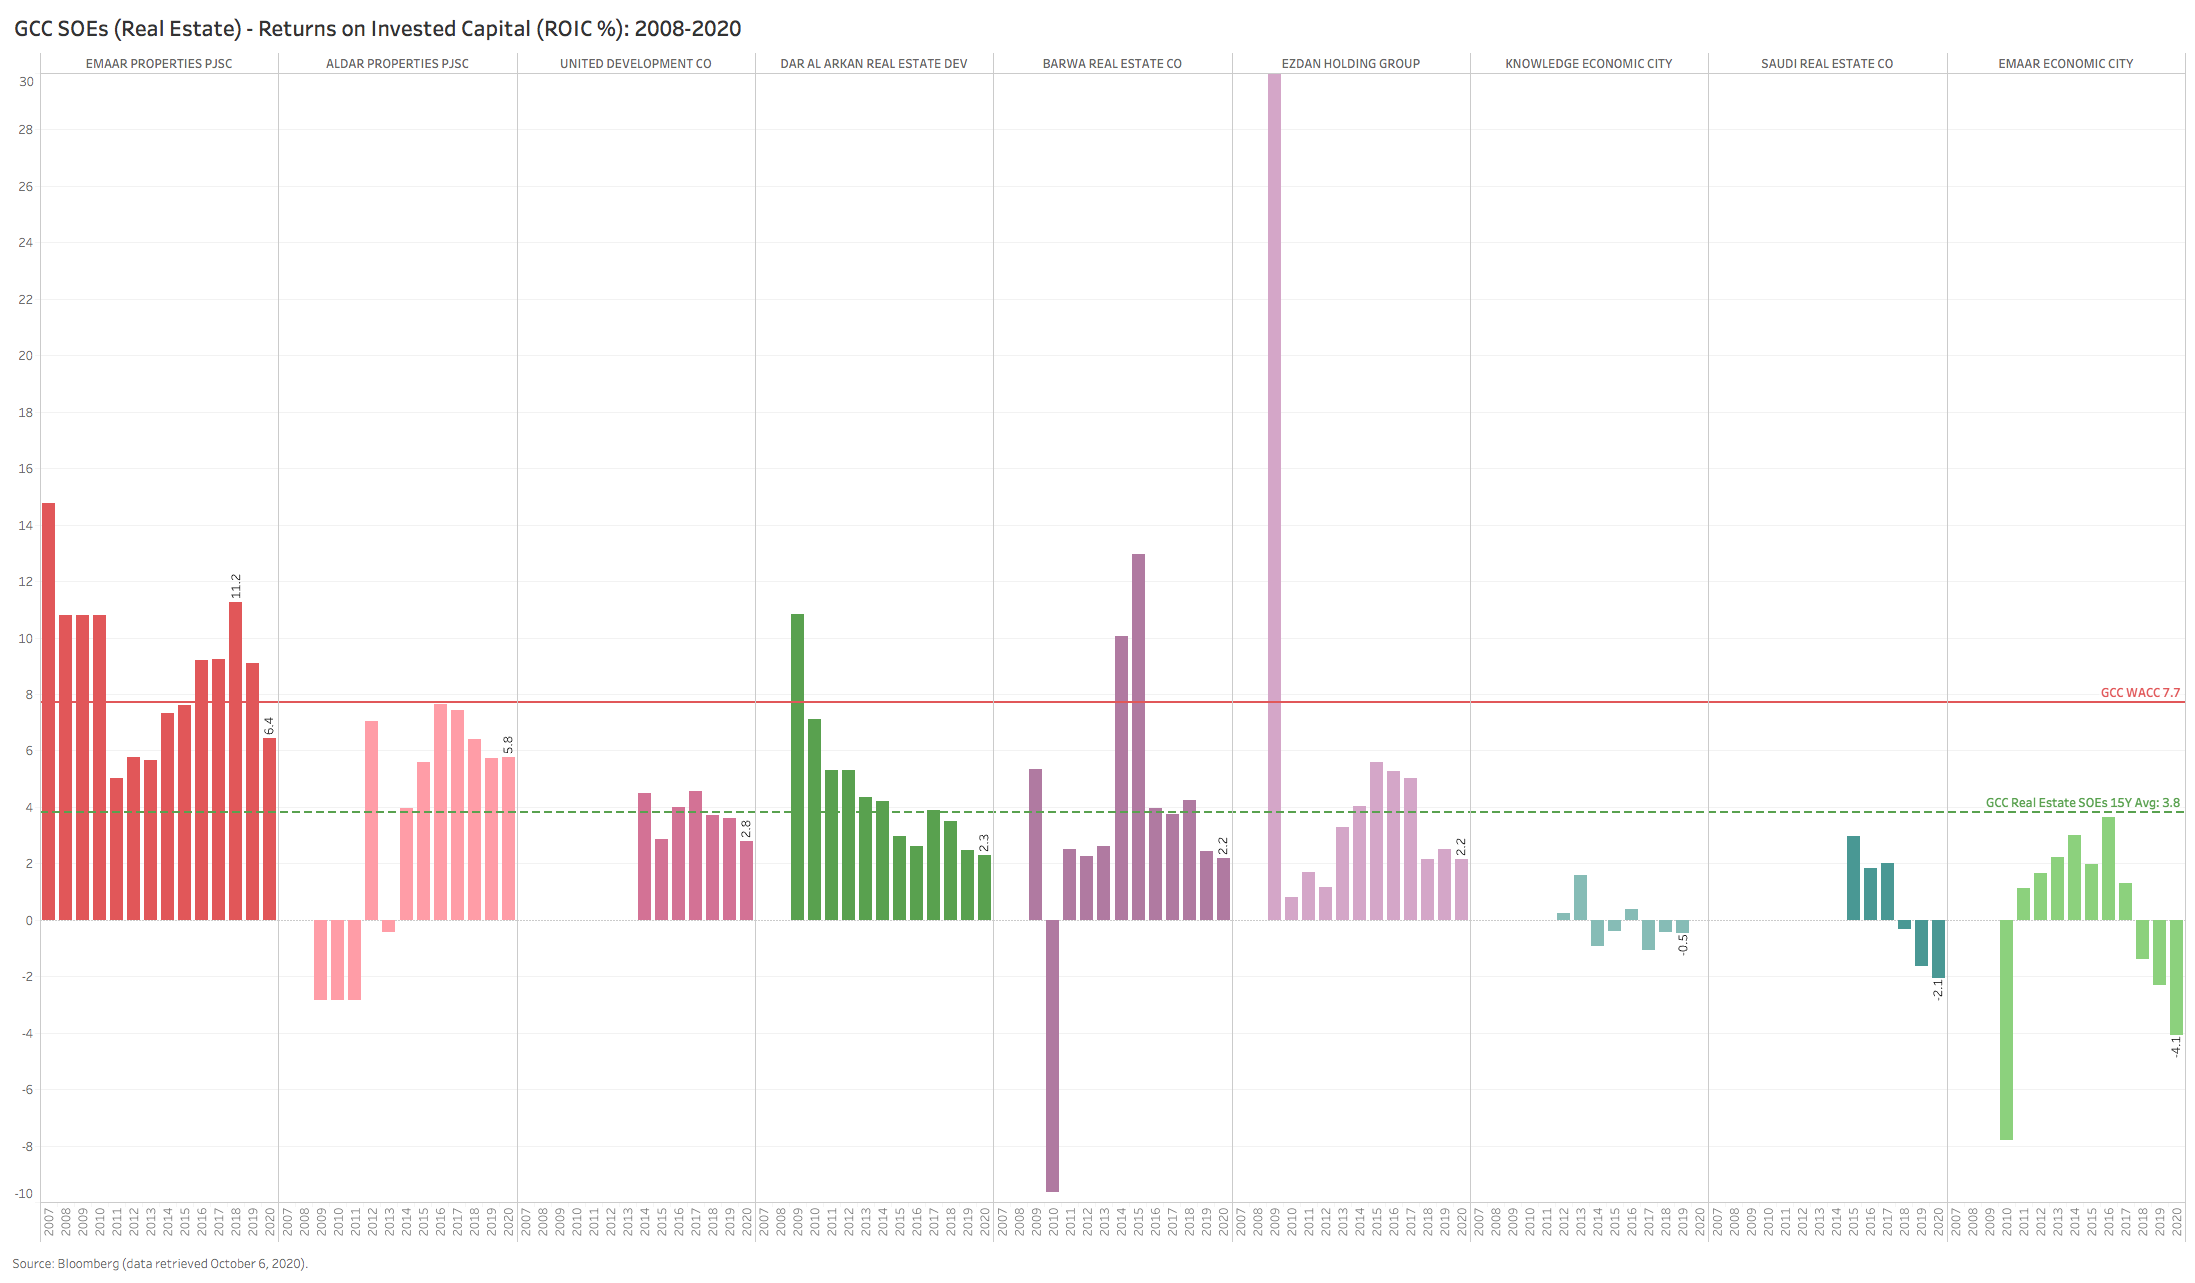
Away from the telcos and banks, the other major sectors where SOEs are dominant (real estate, utilities, industrials, materials) all show both highly negative EVA (where the returns on capital are significantly below the cost of capital) and sharply deteriorating ROC trends. In all cases, and due to the high fixed-cost and capital-intensive nature of these industries, these SOE in many cases are now facing very high levels of negative operating leverage, where high positive returns profiles of the past 15 years are now (in some cases) negative (e.g. SABIC, IQ, most of the GCC SOE petrochemical names, and several of the real estate companies – see Charts 9-11 below).
Chart 10: GCC SOE Sample (Real Estate) – ROICs (2008-2020)
Chart 11: GCC SOE Sample (Utilities) – ROICs (2008-2020)
Chart 12: GCC SOE Sample (Telecoms) – ROICs (2008-2020)
Chart 13: GCC SOE Sample (Banks) – ROEs (2008-2020)
On the other hand, the small number of private sector GCC companies are not only generating much higher aggregate returns on capital vs their SOE peers (Charts 14 & 15 below), but the recent trend in returns for many franchises is much more encouraging. Companies like Jarir, Aramex, United Electronics, Mouwasat, Al Othaim, Bupa, Al-Rajhi Bank and Bank Al-Bilad – all have shown incredible resilience in terms of their return profiles over the past 5 years. This is not a small feat, especially in light of how uneven the overall playing field is in their respective markets.
Note to Readers: For a better viewing of charts, please right click the chart image and open as a new window to view in full resolution.
“Iraq reminds me of a classic Shakespearean tragedy – whenever you think things just can’t get any worse, the plot surprises you by taking yet another major step down.”
George Soros (2007)
“When I assumed responsibility, I found an almost empty treasury and an unenviable situation after 17 years of change. Our sovereignty continued to be deficient, violated and doubted. The past period did not see any [effort to] upgrade vital sectors as industry, investment, food self-sufficiency and others. The current crisis [affects] all state institutions and aspects of Iraq’s development and economic revival.”
Prime Minister Mustafa Al-Kadhimi (Baghdad Today, May 2020)
“To recognize the presence of genuine political action in the Arab spring is to reject a narrative of nihilism in favor of a call to political responsibility. It is time to recognize that the future of the Arabic-speaking world is and ought to be made by the people who live there, not from the outside. Their successes and failures will be, and must be, their own.”
Noah Feldman, The Arab Winter – A Tragedy (2020)
Introduction
The first quote above was delivered to me and my partner at the end of a long conversation with George Soros in the Spring of 2007 (he was then Chairman & CIO of the Quantum Fund) on the subject of Iraq & Syria. We had just returned from a trip to the region and briefed Soros on our findings and overall impressions. One of George’s more admirable and impressive qualities is his willingness and sincere interest to listen to alternative points of view. He did so with the patience and humility that few with his stature, experience and wisdom tend to have.
After completing our debriefing on both countries, Soros gave us his frank assessment for Iraq (the quote above was his poetic endnote). In the vein of most Shakespearean tragedies, George saw the flaws and grave errors of what was at the time a new Iraq – emerging from nearly three decades of wars, sanctions, ethnic/sectarian conflicts and insurgencies. Soros was not only a vocal critic of the Bush administration’s decision to invade Iraq in 2003, but remained deeply skeptical of the political, social and economic structures the country inherited from its American liberators and which the Iraqis adopted thereafter.
In retrospect, George’s snap assessment of Iraq proved prescient. In the decade that followed 2007, Iraq, its economy and the Iraqi people faced innumerable obstacles, disappointments and challenges, some of which proved later to be existential in nature. Iraq’s newly appointed prime minister, Mustafa Al-Khadhimi’s public proclamation to a local newspaper (the second quote above), given during the early weeks of his premiership in May this year, aptly summarizes Iraq’s depressing yet pragmatic report card for the past 17 years – undoubtedly the prognosis of a failed state.
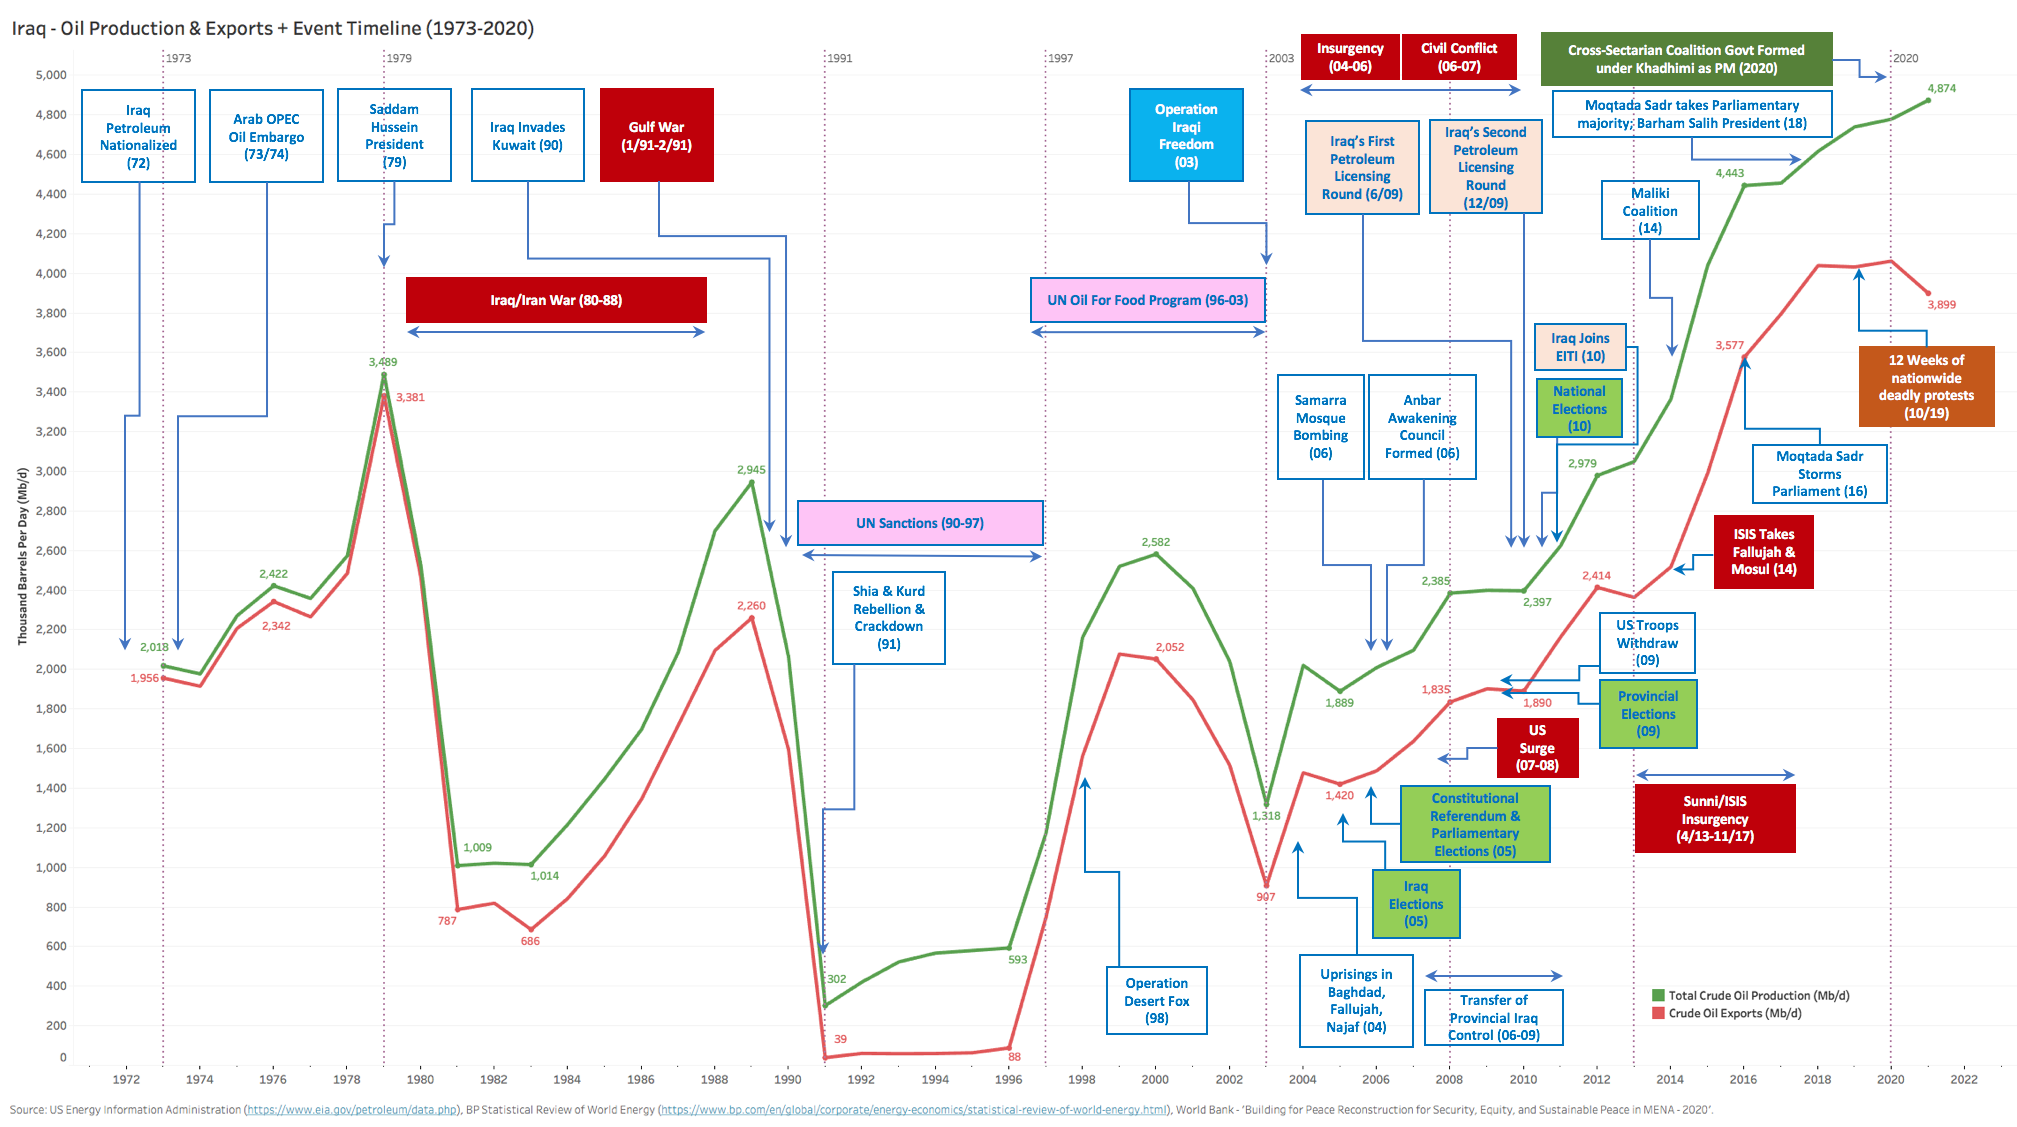
We won’t rehash Iraq’s troubling recent political history since far too many pundits have done so over the years at great length. If you want to see a snapshot of key milestone events from Iraq’s early history to the present day, please refer to Table 1 in the Appendix and Charts 1 & 2 later on in the note (the latter super-imposes trends on Iraq’s per capita income and oil production). Iraq may be an outlier in terms of the degree of tragedy it has experienced and the duration of its struggles, but one cannot argue that the country’s experience over the past few decades is a big departure from those of the region it is located in. Even though the Iraqi historical arc’s amplitude may be greater than that of its neighbors, the general trend is unfortunately quite similar across the Arab World at large.
As a result, we believe that it may be particularly useful at this juncture in Iraq’s punishing history to also take a step back and look at the country squarely in the context of the Arab World, especially around the period of the Arab spring protests and the aftermath of the 2011 uprisings. Iraq remains a very complex puzzle, though we find that sometimes by looking through a specific conceptual lens (like that of the Arab spring’s post-mortem) one can potentially clarify and simplify what is otherwise a very noisy picture.
The new wave of protests across the region that began in 2019 and extended well into 2020 in Algeria, Sudan, Lebanon and Iraq seem very familiar to us as onlookers. The first Arab spring, when it began to spread in 2011, from Tunisia to Egypt, and eventually engulfing most Arab states, left several countries relatively unscathed. The likes of Lebanon and Iraq did not fully participate in this first wave of uprisings, primarily because their uniquely sectarian political systems created a formidable distraction for the deeply divided masses. These sectarian cleavages made it easy for an individual party to deflect blame onto the other.
Fast forward to 2019 and the overall environment has deteriorated to such an extent in these countries that it is impossible for any individual party in the ruling class to hide from responsibility. The people across Iraq and Lebanon have taken to the streets accusing all politicians for having failed them, inclusive of their partisan overlords. With one voice they are now loudly rejecting the sectarian system that the status quo rests on, unifying under a banner of nationalism and reform while calling on a complete overhaul of the system of governance. Déjà vu?
But this time at least feels different. Iraq has experienced its largest mass protests since 2003-4, a period of huge distress that followed the US invasion and a wholesale change in regime. Iraqis of all stripes are now loudly claiming that the sectarian system that was put in place post-2003 is not workable. The muhassassa (a pluralistic-intended system based on rigid sectarian quotas) has only yielded an outcome of institutionalized favoritism based on sect and ethnicity, allowing political parties to effectively divvy up the oil wealth between them by turning ministries into sectarian fiefdoms. According to experts such as Emma Sky (a Yale lecturer, former advisor to the US-CPA and author of several important books on Iraq), the country has devolved into a kleptocracy in short order.
Many western observers of the Arab World dismissed the consequences of the first Arab spring protest movements (or uprisings) of 2011 as either abject failures or meaningless experiences that have either led to chaos, tyranny, terror or (at best) a fragile stability derived from a reprofiling of the old autocratic political structure. We believe that this prognosis is not only simplistic but also quite premature. This is especially the case if one considers that the uprisings in 2011 were in fact only the first phase of a longer-term transition, driven at its core by a powerful assertion of self-determination. We firmly subscribe to this view and believe that the first Arab spring was in fact a generational watershed moment for most Arab countries, a collective awakening of sorts and a potent catalyst for what is likely to be a lengthy process of transformation rather than a finite and conclusive event in itself.
The final quote above from Noah Feldman’s 2020 book – The Arab Winter encapsulates this intellectual framework where he labels the second phase of this transition process as an ‘Arab winter’. According to Feldman, the 2011 uprisings signaled “a new, unprecedented phase in Arab political experience, in which participants engaged in collective action for self-determination that was not conceived primarily in relation to imperial power”. Arab protesters exercised something quite rare for the countries of the region – “political agency” and a “courageous pursuit of a more just political order.” Whether they did so as a result of the failure and subsequent weakening of external influences (US, GCC, Iran, Russia, Turkey) or whether the Arab streets advocated a more democratic model in the transition (or a rejection of a democratic result as in the singular case of Egypt) – these are questions that can and have been debated. The key take-away for us from the original Arab spring was that the experiment with self-determination in fact succeeded in engendering change. Whether this change can be transformational is yet to be determined.
Across the Arab World however, in almost all cases of upheaval thus far (arguably with the lone exception of Tunisia), the tragedy of “inconsequential change” persists well into this second phase, while in some cases the tragedy in fact has intensified through repression of civil society, rising levels of inequality (income- and gender-based in particular), an erosion of living standards, higher levels of physical displacement (internally-displaced or refugees), internal civil strife, and in some cases even armed conflict.
However, because the claim of self-determination is now established in most countries, it is far less likely to be muffled indefinitely. Pandora’s box is now open and only the countries that can afford to effectively bribe their citizens into passive submission for extended periods (e.g. some of the smaller Gulf States with huge hydrocarbon resources per capita) will be able to temper this claim indefinitely. Subsequent uprisings are therefore inevitable, especially since the new status quo has failed to address protesters’ claims for social justice, more representative governance and more equal access to economic opportunity. The water in the metaphorical pot will remain very hot unless the heat is structurally removed, with the inevitable risk of boiling over as long as the status quo persists.
So far, one of the key deficiencies for any successful country transition has been the absence of a credible alternative political option to the incumbent autocratic governments – one that can deliver on security, opportunity as well as freedom (of all forms, including political, religious, civil and expression). The experiment with political Islam as a chosen form of governance has resoundingly failed in this respect, with contrasting post Arab spring experiences in Egypt (the rigid and exclusionary Muslim Brotherhood) and Tunisia (the progressive and accommodating Ennahda) both reaching similar failed outcomes, albeit with varying degrees.
Nevertheless, autocracies for the most part not only continue to come up short in addressing key issues of social justice, economic inclusion and sustainable growth, but have protected their hold on power by reinforcing the influence of vested interests and crony capitalists that are appendages of the ruling regimes. Therefore, we believe that subsequent uprisings are inevitable and may eventually come at a time where a transition to an alternative form of governance grows more likely. Legacy autocratic regimes are progressively becoming weaker and more vulnerable due to failing social and economic models, while credible alternative leadership (many from younger generations) eventually evolves and finally emerges onto the political stage. This will likely be a slow and drawn out process, with very different paths and outcomes for each country, but one that is worth watching closely.
So where is Iraq in this context of post-Arab spring evolution?
The US’s mishandling of the occupation (2003-10), beginning with the disastrous US decision to dissolve the army and police force, delayed the devolution of power and a return of security. As a result, this stunted the process of rebuilding a proper and sustainable institutional bedrock for the country. Furthermore, Iraq’s chosen political model (the 2005 constitution and the first series of parliamentary elections) was quite exclusionary, alienating the large Sunni Arab minority. This decision laid the ground for years of civil strife and eventually the spread of ISIS into Iraq from Syria, creating an existential threat to the federal state. Fast forward to 2020, and with several years of relative autonomy, a semblance of security, and with some inklings of democratic institutions having been formed, Iraqis of all stripes are now able to collectively claim their self-determination more assertively and across partisan lines. They have done so as a reaction to a disastrous governance track record and the absence of an occupying force like the US to direct blame towards.
But Iraq is not alone in this current phase of upheavals. Just as we witnessed in the 2011 Arab spring uprisings, the wave of discontent has begun to spread once again to the weakest links across the Arab World. Since the spring of 2019, in addition to Iraq, governments in Algeria, Sudan and Lebanon have been brought down by mass protests with chants and slogans that are eerily similar to those we heard almost a decade ago. With the precipitous fall in oil prices that followed the outbreak of the COVID-19 pandemic in early 2020, we have also begun to see huge economic and social vulnerabilities emerge in both hydrocarbon-exporting countries and importing countries alike due to ill-equipped economic models, inadequate health infrastructure and weak social safety nets. Unlike the period following the Global Financial Crisis (2008-9) where global liquidity and rebounding oil prices were enough to soften the impact of local recessions (‘bribe the masses and hope for submission’), the current environment is fraught with record-setting deficits, extended sovereign balance sheets and even less inclusive and more repressive political structures.
As investors, a key question we are challenged to address at this juncture is: How close are these countries to reaching what Feldman calls the point of Catharsis[1], which he describes as the “inevitable culmination of most tragedies”?According to Aristotle, the Greek word “catharsis” is a “purging or a purgation; an inner experience that transcends the emotions of terror and pity and turns them into something cleansing.” Feldman also offers up Ibn Rushd’s nuanced, Arabic-lens interpretation for a tragic catharsis which takes the concept of catharsis further and considers the reaction to a tragedy as “not [merely a] reflection, but the doing of politics as the highest form of human flourishing.” Feldman explains that “the point of tragedy, in this vision, is to offer inspiration for the exercise of virtue. Tragedy can thus be made to have a practical, forward-looking purpose. It can lead us to do better.” We interpret this as the point where extreme adversity for a country finally leads to bold action – an inflection point towards the noble pursuit of transformational reforms in governance.
When will any of the Arab states reach this critical inflection point? Is it also possible that some countries never reach this cathartic stage, instead they muddle along indefinitely through an endless cycle of tragic outcomes? Every country obviously has very different circumstances and conditions, different resources to draw upon, varying demographic constraints, differing touchpoints, external influencers and (most importantly) thresholds for collective pain & suffering. At the conclusion of his book, Feldman summarily predicts that the “current winter may last a generation or more” and thus conveniently relieves himself from the challenge of predicting this important pivot. As an investor, we don’t have this intellectual luxury.
Is Iraq now at the point of maximum pain and thus able to turn its tragic catharsis into actions that are constructive, noble and virtuous? Is Iraq ready to finally turn the corner and begin a new and exciting transformation that will offer the young generation of Iraqis a brighter future? Are the necessary ingredients now in place for such a transition to occur: security, rule of law, basic institutional fabric and the emergence of a new political class that is ready to govern inclusively?
It is difficult to predict this. Instead, in this note, we have chosen to take a contrarian perspective, and ask a far less popular, yet a deliberately contingent question instead: what might Iraq look like in 10 years if in fact the country is successful in pursuing a real transformation? If the new Iraqi leadership decides to take a ‘noble’ governance path instead of the path of least resistance, what might the future look like and what implications will this have on Iraq’s potential economic growth, the country’s sovereign risk profile and ultimately the country’s investable asset classes?
We will first draw out the current historical picture a bit further, explaining our views of the political and economic context for transition, highlighting both the positive aspects that reinforce the potential for successful reforms taking hold as well as the formidable obstacles that they face. We will conclude with a fresh look at Iraq’s nascent banking ecosystem and capital markets, which is always a great perspective into a country’s real economy and its potential for normalized growth.
A few notes for our chosen format of analysis. We love data and we love charts that illustrate and amplify the information contained in the data. Each chart or table paints a picture and each picture is in turn a small piece of a bigger puzzle that helps to flesh out a particular narrative. We have tried to be as objective and as thorough as possible in our analysis of the data, and therefore we use a lot of charts! Since most of the charts are packed with lots of granular data, we also chose breadth over conciseness. Charts that speak directly to specific analysis are contained in the main body of the note while those in the Appendix are there mainly for reference. Readers are recommended to open each of the charts in a separate window (right click and open in a separate browser page or download into a picture file) in order to view the entirety of the chart in full resolution.
POLITICAL TRANSITION
As with many fragile and post-conflict developing countries, most of the analysis on Iraq tends to be myopic, incredibly reactionary and overly retrospective in nature. As a result, and because Iraq’s historical coverage is so extensive, any evaluation invariably gets bogged down in so much historical noise. Testament to this is the typical view of Iraq’s modern history by most historians and economists. Abbas Alnasrawi, a noted economic historical scholar, encapsulates this common image best in his book ‘The Economy of Iraq: Oil, Wars, Destruction of Development Prospects’: “the country’s political history can be rewritten as an endless series of coups and countercoups; conspiracies; purges and counter-purges; violent seizures of power; ruthless suppression of dissent; and wars, adventures, and sanctions. In all this history, the people had no voice -there has been a virtual absence of democratic institutions and political parties.” But that cannot be the whole story or only what one takes away from such a tragic series of events.
Nevertheless, the full arc of Iraq’s history is fundamental to understand how the country has evolved and where its political, social and economic profile stands presently. What we do find particularly useful though is to zoom out of the noise and look at key pivots in Iraq’s history – the events that have real gravity, the big turning points and key decisions that, in perfect hindsight, proved to have altered the direction of policy and reforms in a material manner.
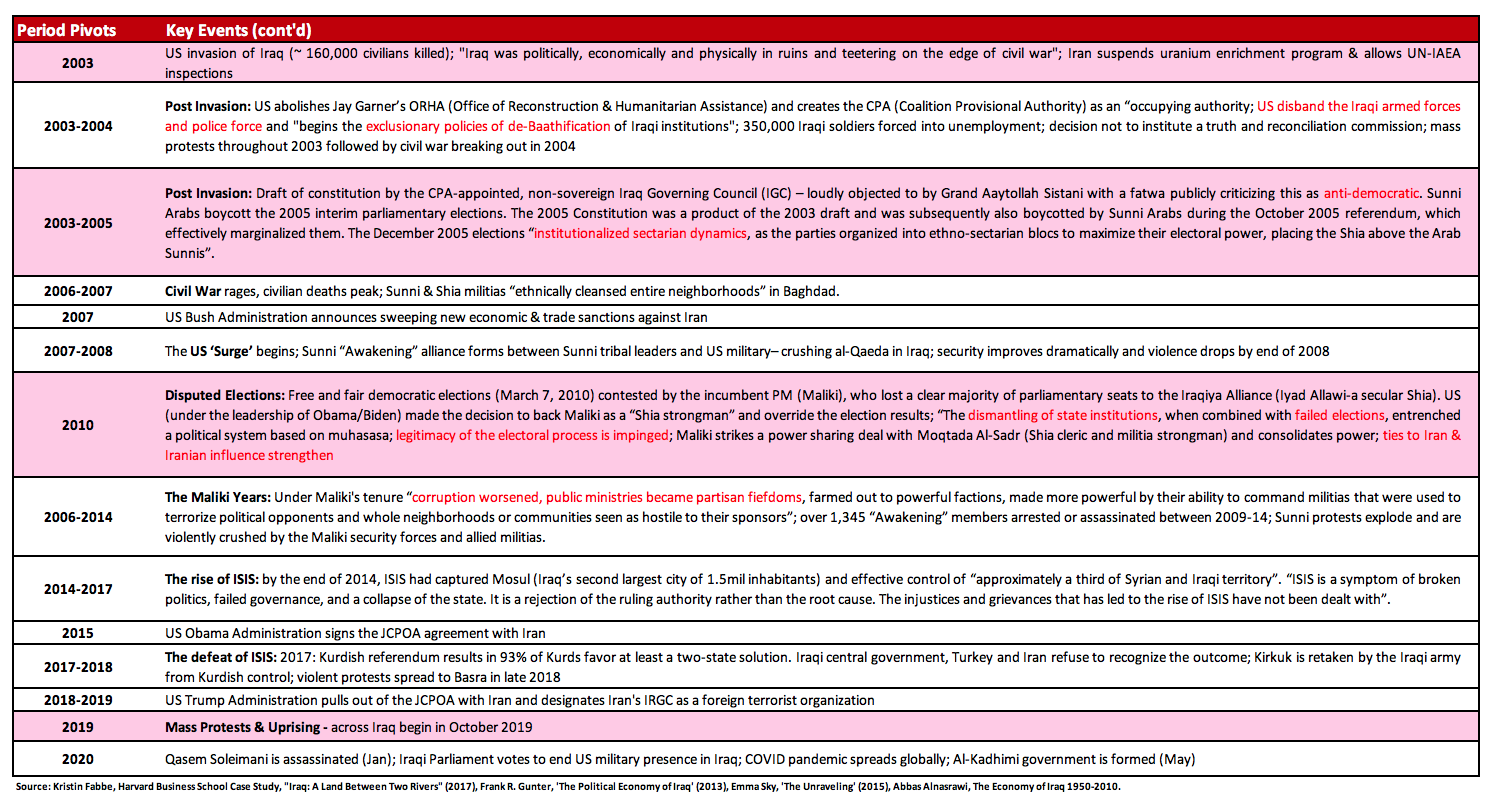
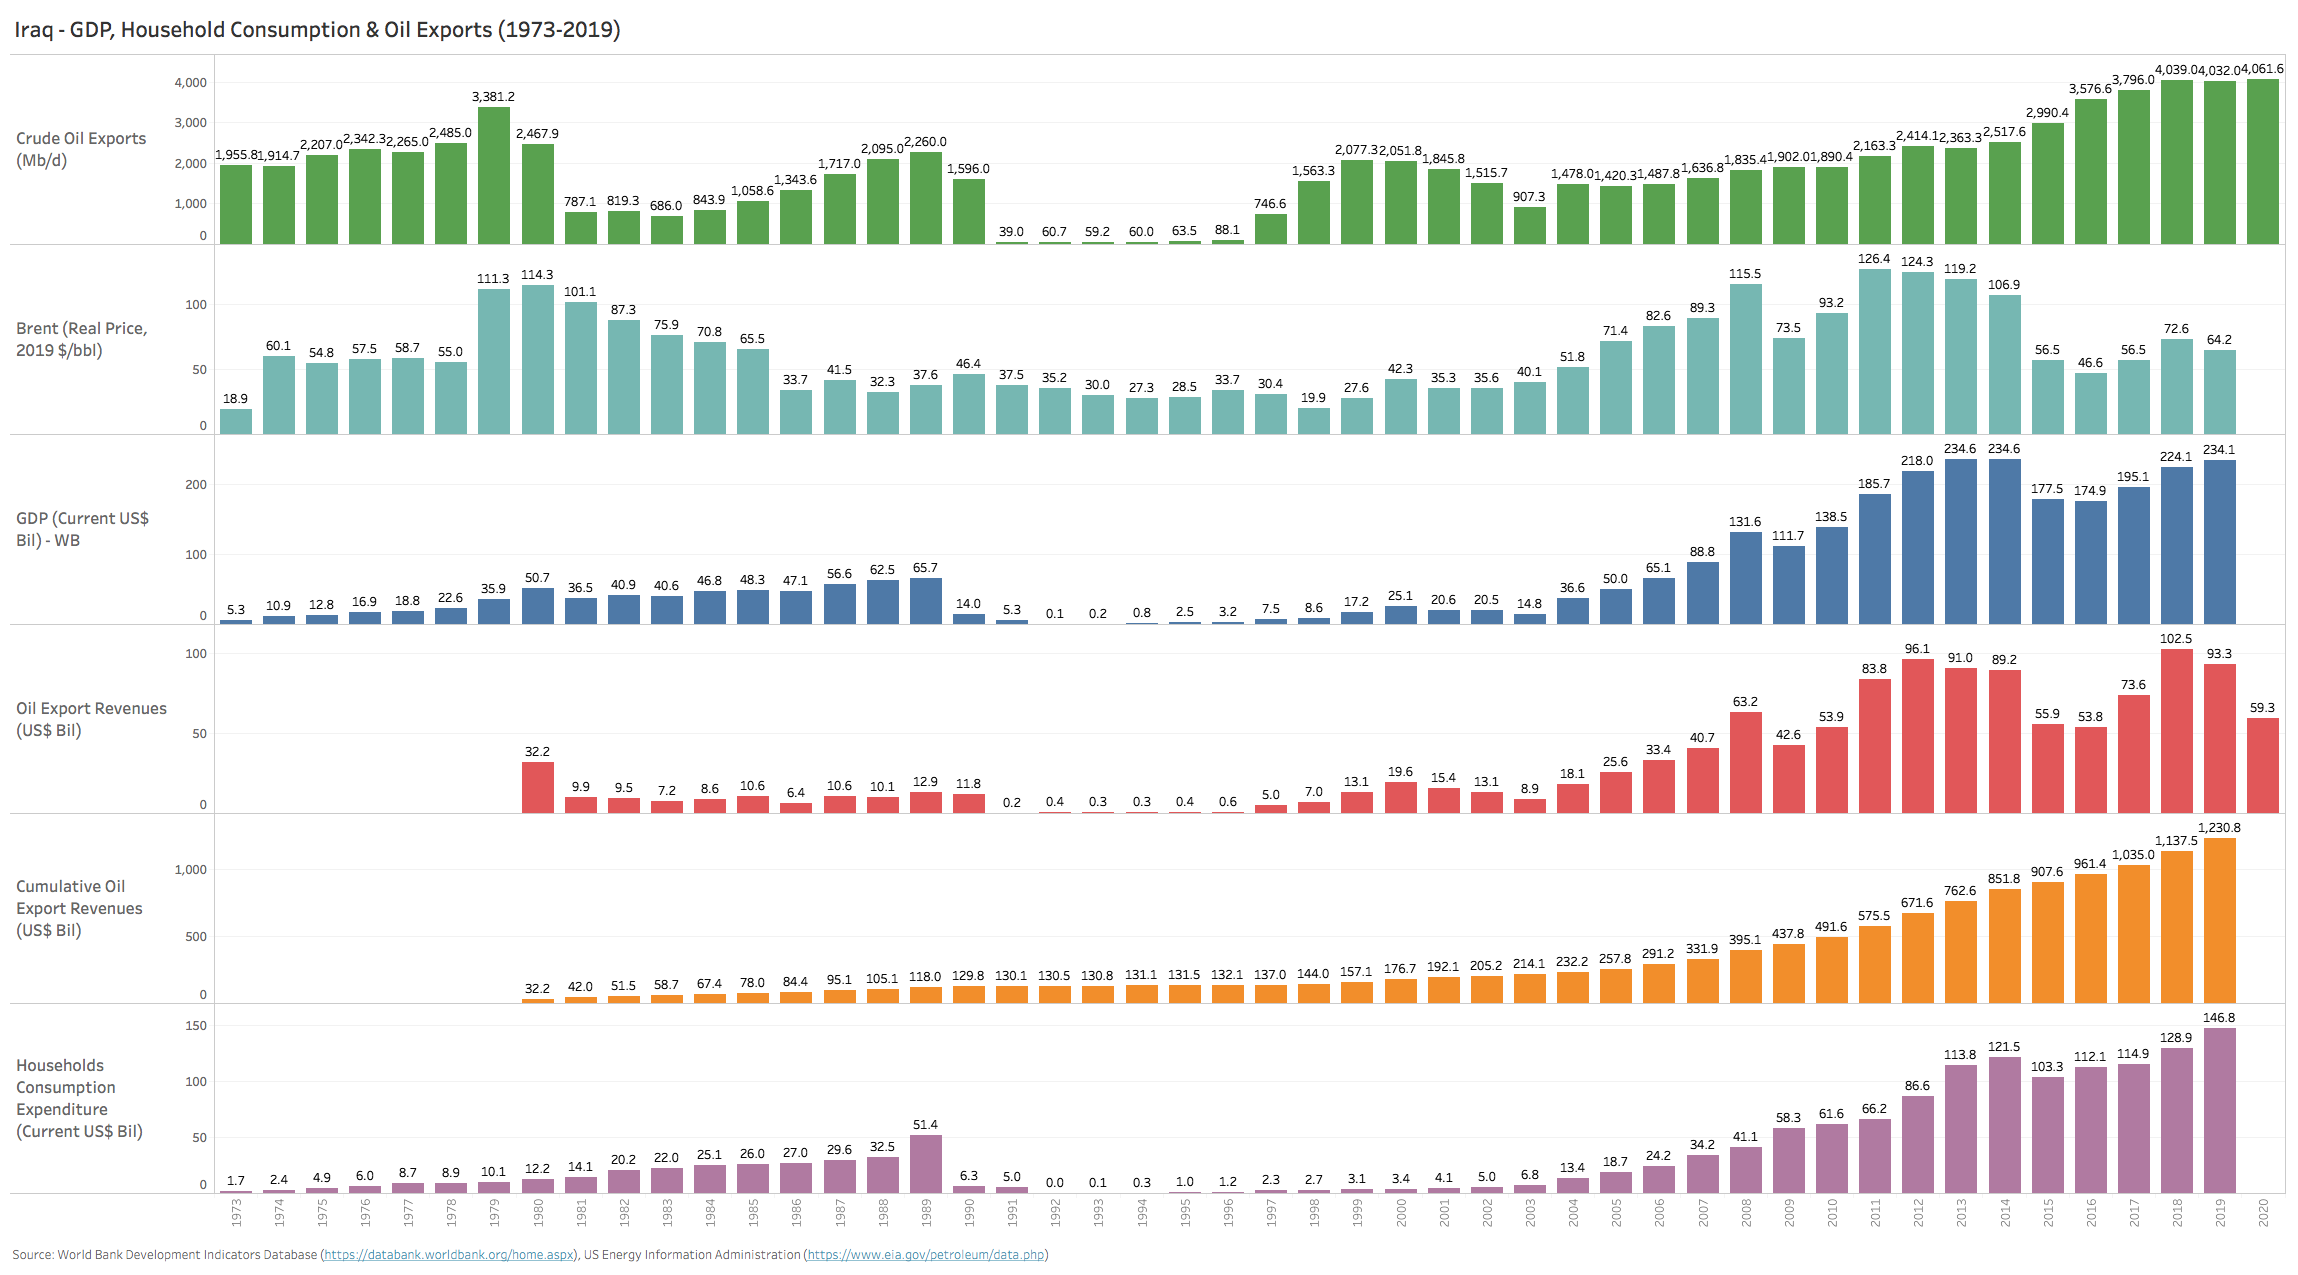
Unsurprisingly there are quite a few of these important pivots for a country with such a volatile history as Iraq. Table 1 in the Appendix is just a short summary list of some of the most prominent turning points that we lifted primarily from a superbly written country case study published by Professor Kristin Fabbe of the Harvard Business School in 2017 titled ‘Iraq: A Land Between Two Rivers’ (2017) (emphasis/highlights in the table are ours). Because our perspective is tinted mainly with an economic/investment lens, we will weave in several of these pivotal periods and milestones in the economic transition section of the note below. Charts 1 & 2 below also super-impose trends in Iraq’s oil production, oil exports, per capita income, per capita household spending and per capita oil export revenue onto the historical timeline for the reader’s reference. While the pre-2003 trends are not at all surprising, the post-2003 trends are especially noteworthy, despite (or as a result of) the incredible amount of event ‘noise’ during the early stages of Iraq’s post war transition.
Beyond the obvious key milestones of: 1) the 1973 nationalization of the oil sector (arguably the beginning of Iraq’s ‘rentier’ stage), 2) the 1979 Iranian revolution which shook the bi-polar balance of power of the region and acted as a catalyst for the Iran-Iraq war and 3) the 2003 US invasion of Iraq, two more recent events are also worth highlighting here since we believe that they have had a disproportionate impact on where Iraq now finds itself today: A) the exclusionary drafting of Iraq’s 2005 constitution and B) the highly controversial outcome of the March 2010 election with a resulting blow to the legitimacy of the electoral process and perceived fairness of governance (see Chart 3 below for a summary of the 2005-2018 election results). We believe that these two more recent events also go to the heart of what needs to change politically in order for Iraq to chart a more sustainable path forward.
Chart 3 – Iraqi Election Results: March 2010 & December 2005
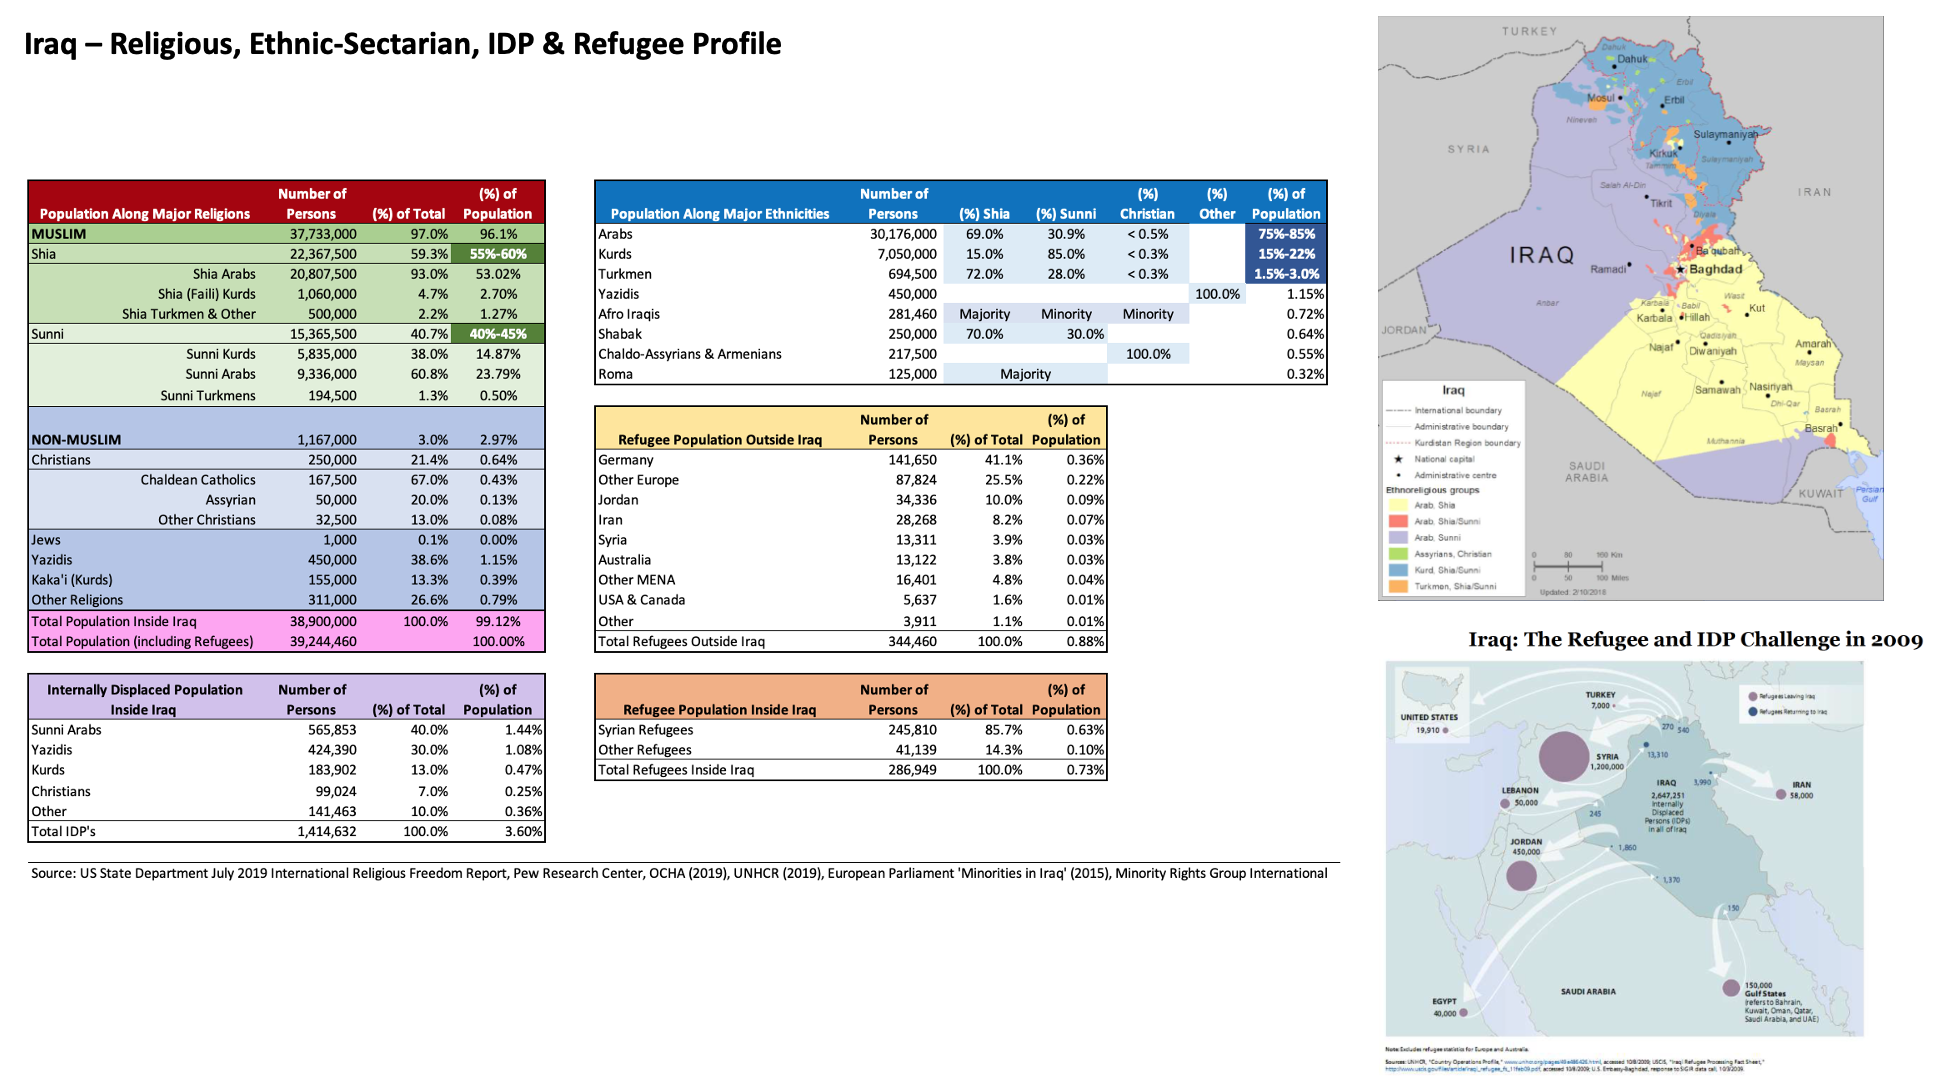
It is also no coincidence that both events were driven by an exclusionary ethno-sectarian policy that has entrenched itself in the Iraqi political system to date, with prospective implications for a dramatic drop in voter turnout and a fracturing of political parties and alliances across partisan lines. Nothing illustrates this more clearly than a contrasting look at Iraq’s current ethnic and religious profile (see Chart 4 below pieced together from several sources; many figures are our own guestimates since a detailed and credible ethnic/religious census is not available). This profile is a virtual kaleidoscope of underlying cultures and belief-structures that literally crisscross one another from a centuries-old brew. Iraq is much more than just Shia-Sunni or Arab-Kurd. The country stands apart from most of its Arab peers in terms of its sheer diversity and the thousands of years of history it has in cultivating this high level of diversity. This is precisely what Iraq’s 2005 constitution and inclusive electoral system were supposed to protect and promote. The 2010 election unfortunately ended up contradicting all of this.
This wrong turn in the road ultimately needs to be reversed and a more inclusive and representative government needs to emerge from prospective elections that are free and fair, without external meddling. Can this happen? Is the institution of Iraq’s young and pluralistic electoral system still intact, or has it been permanently impinged? Equally, can the rushed and misconceived Iraqi constitution be amended whilst protecting its legitimacy without risking the collapse of the federal state? Time will tell, but these are a few of the key catalysts that we will watch closely as we approach the coming June 2021 parliamentary election cycle and its aftermath.
Fast forward to present day events. The 12-week long nationwide protests that began in October of 2019 culminated in the formation of a new coalition government led by Prime Minister Mustafa Al-Kadhimi. We are impressed with what we have seen so far. In our opinion, the new government has all the markings of the most inclusive government in Iraq’s short post-war history (in particular since the adoption of the 2005 constitution) – bringing together groups from across the varied political spectrum: Kurdish, Sunni, Turkmen and Shiite parties, including the large bloc led by popular cleric Muqtada al-Sadr. Kadhimi is also quite different from past heads of state. He has a non-political background (a journalist and human rights activist) and emerges from a younger generation of Iraqis (he is only 53 years old and is now one of the youngest heads of state across the Arab World). Despite this and as a result of his tenure as head of the country’s intelligence service during Iraq’s battle against ISIS, Kadhimi has developed strong relationships with many of the foreign powers that have influence over Iraq’s policies (including the United States, Iran, Turkey and Saudi Arabia). In short order, Kadhimi has managed to achieve sufficient parliamentary backing (something two preceding PM candidates were unsuccessful in accomlishing) and is now garnering strong popular support. Early days.
Most of all, we like the fact that Khadhimi does not belong to an established political party or is beholden to a foreign- or militia-backed group. He therefore must align the interests of disparate political and ethno-religious groups from a neutral and pragmatic position. Testament to this posture of neutrality is Kadhimi’s stated priorities as PM: a) he intends to dismantle the muhasasa system (ethno-religious-sectarian quota system that is at the root of political favoritism and self-serving corruption), b) push through long-planned but delayed structural economic reforms, c) return the huge number of internally displaced Iraqis to their homes and d) delicately rebalance the foreign political influence of pestering neighbors (Iran and the GCC) and old geopolitical patrons (the US). A tall order for any leader – to say the least.
Time will tell if Kadhimi is successful. We do however sit up and take notice when such a meaningful and potentially game-changing shift in leadership takes place, especially if the new leadership is presumably clean (his anti-corruption credentials are noteworthy), politically neutral and explicitly pro-reform. What caught our attention the most with Kadhimi’s mandate proclamations was his explicit recognition that Iraq needs to diversify away from its huge reliance on oil. Along with bridging the ethno-sectarian divide and thus tackling the root of corruption head-on, we believe that finally addressing Iraq’s stubborn ‘resource curse’, are the two most important and fundamental issues that Iraq faces as it transitions.
We have always believed that developing countries in transition like Iraq only adopt deep and generational structural reforms when they absolutely need to (not necessarily when they ‘can’). The more adverse the situation a country finds itself in, typically the stronger the anchor tends to be for deep and lasting reforms. Iraq’s ‘tragedy’ of the past 40+ years has created precisely the setting for this kind of anchored reform environment. Add to this cocktail the residual effects of decades of sanctions, dilapidated post-war infrastructure, endemic corruption, chronic political unrest, and a growing outbreak of COVID-19 in the past 6 months, and this may be the recipe for a potent catharsis moment.
One thing that most analysts do not acknowledge loudly enough is the fact that Iraqi nationalism has (so far) survived all of these existential challenges, extreme tensions and sporadic outbreaks of violence. An objective observer of history could argue that this nationalist resilience has persisted since at least 1933. Despite the plethora of predictions of the country’s destined split-up along major ethno-sectarian lines, the federal Iraqi state has surprisingly survived, albeit in an acutely decentralized form. The country, through a deliberate and iterative process over the past 15 years has managed to maintain some semblance of a functional nation state- something that is quite impressive (for most – it is downright surprising) in light of all the big cleavages.
Demographics
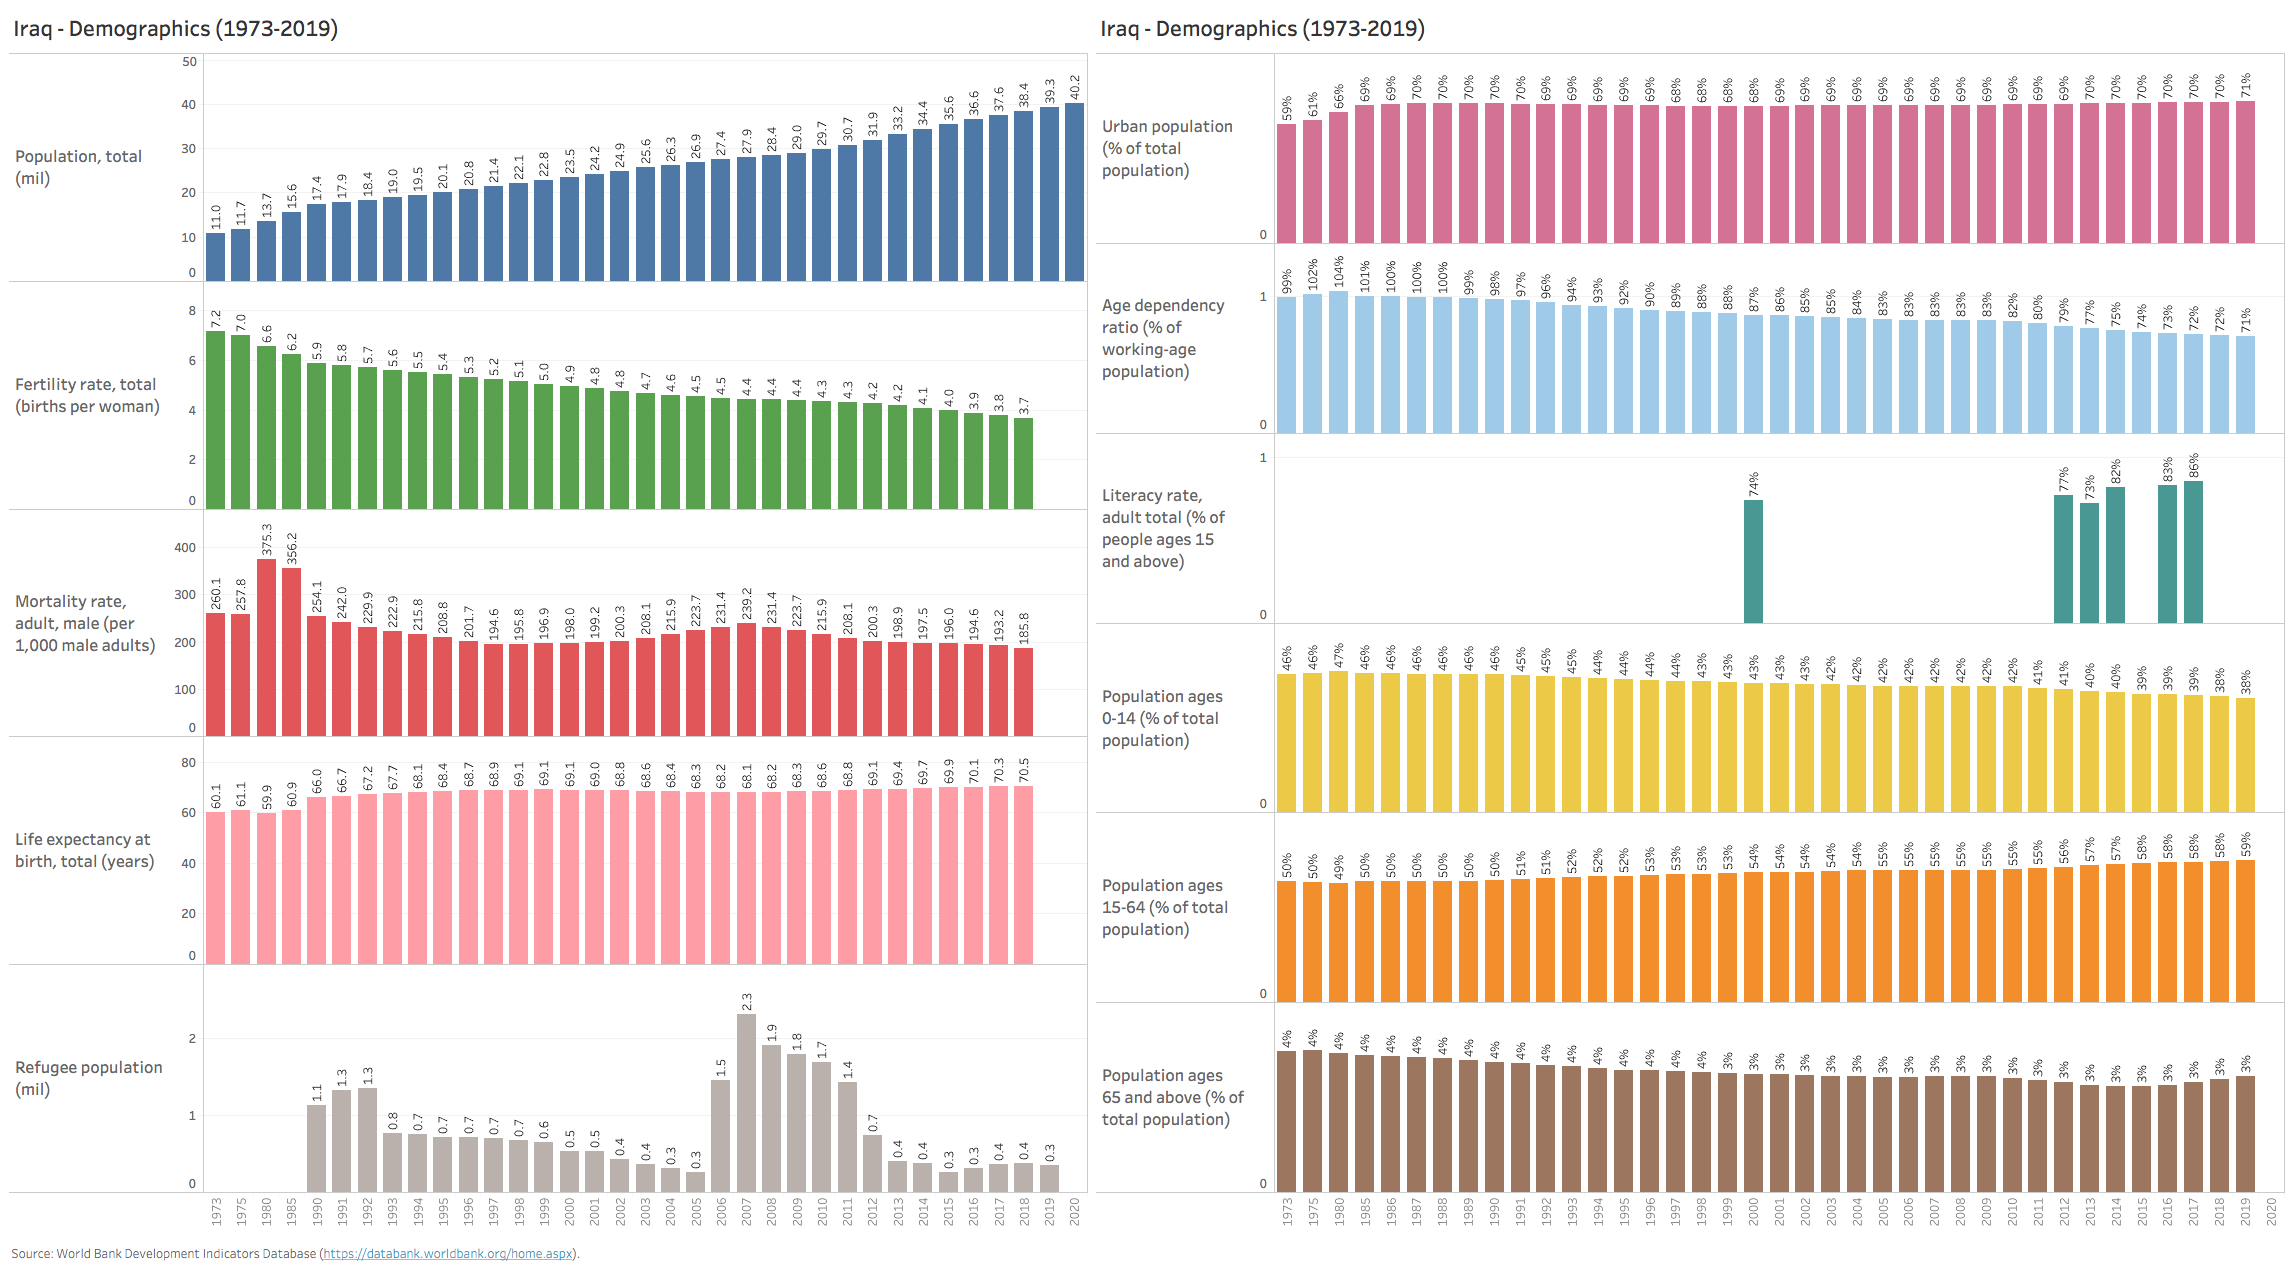
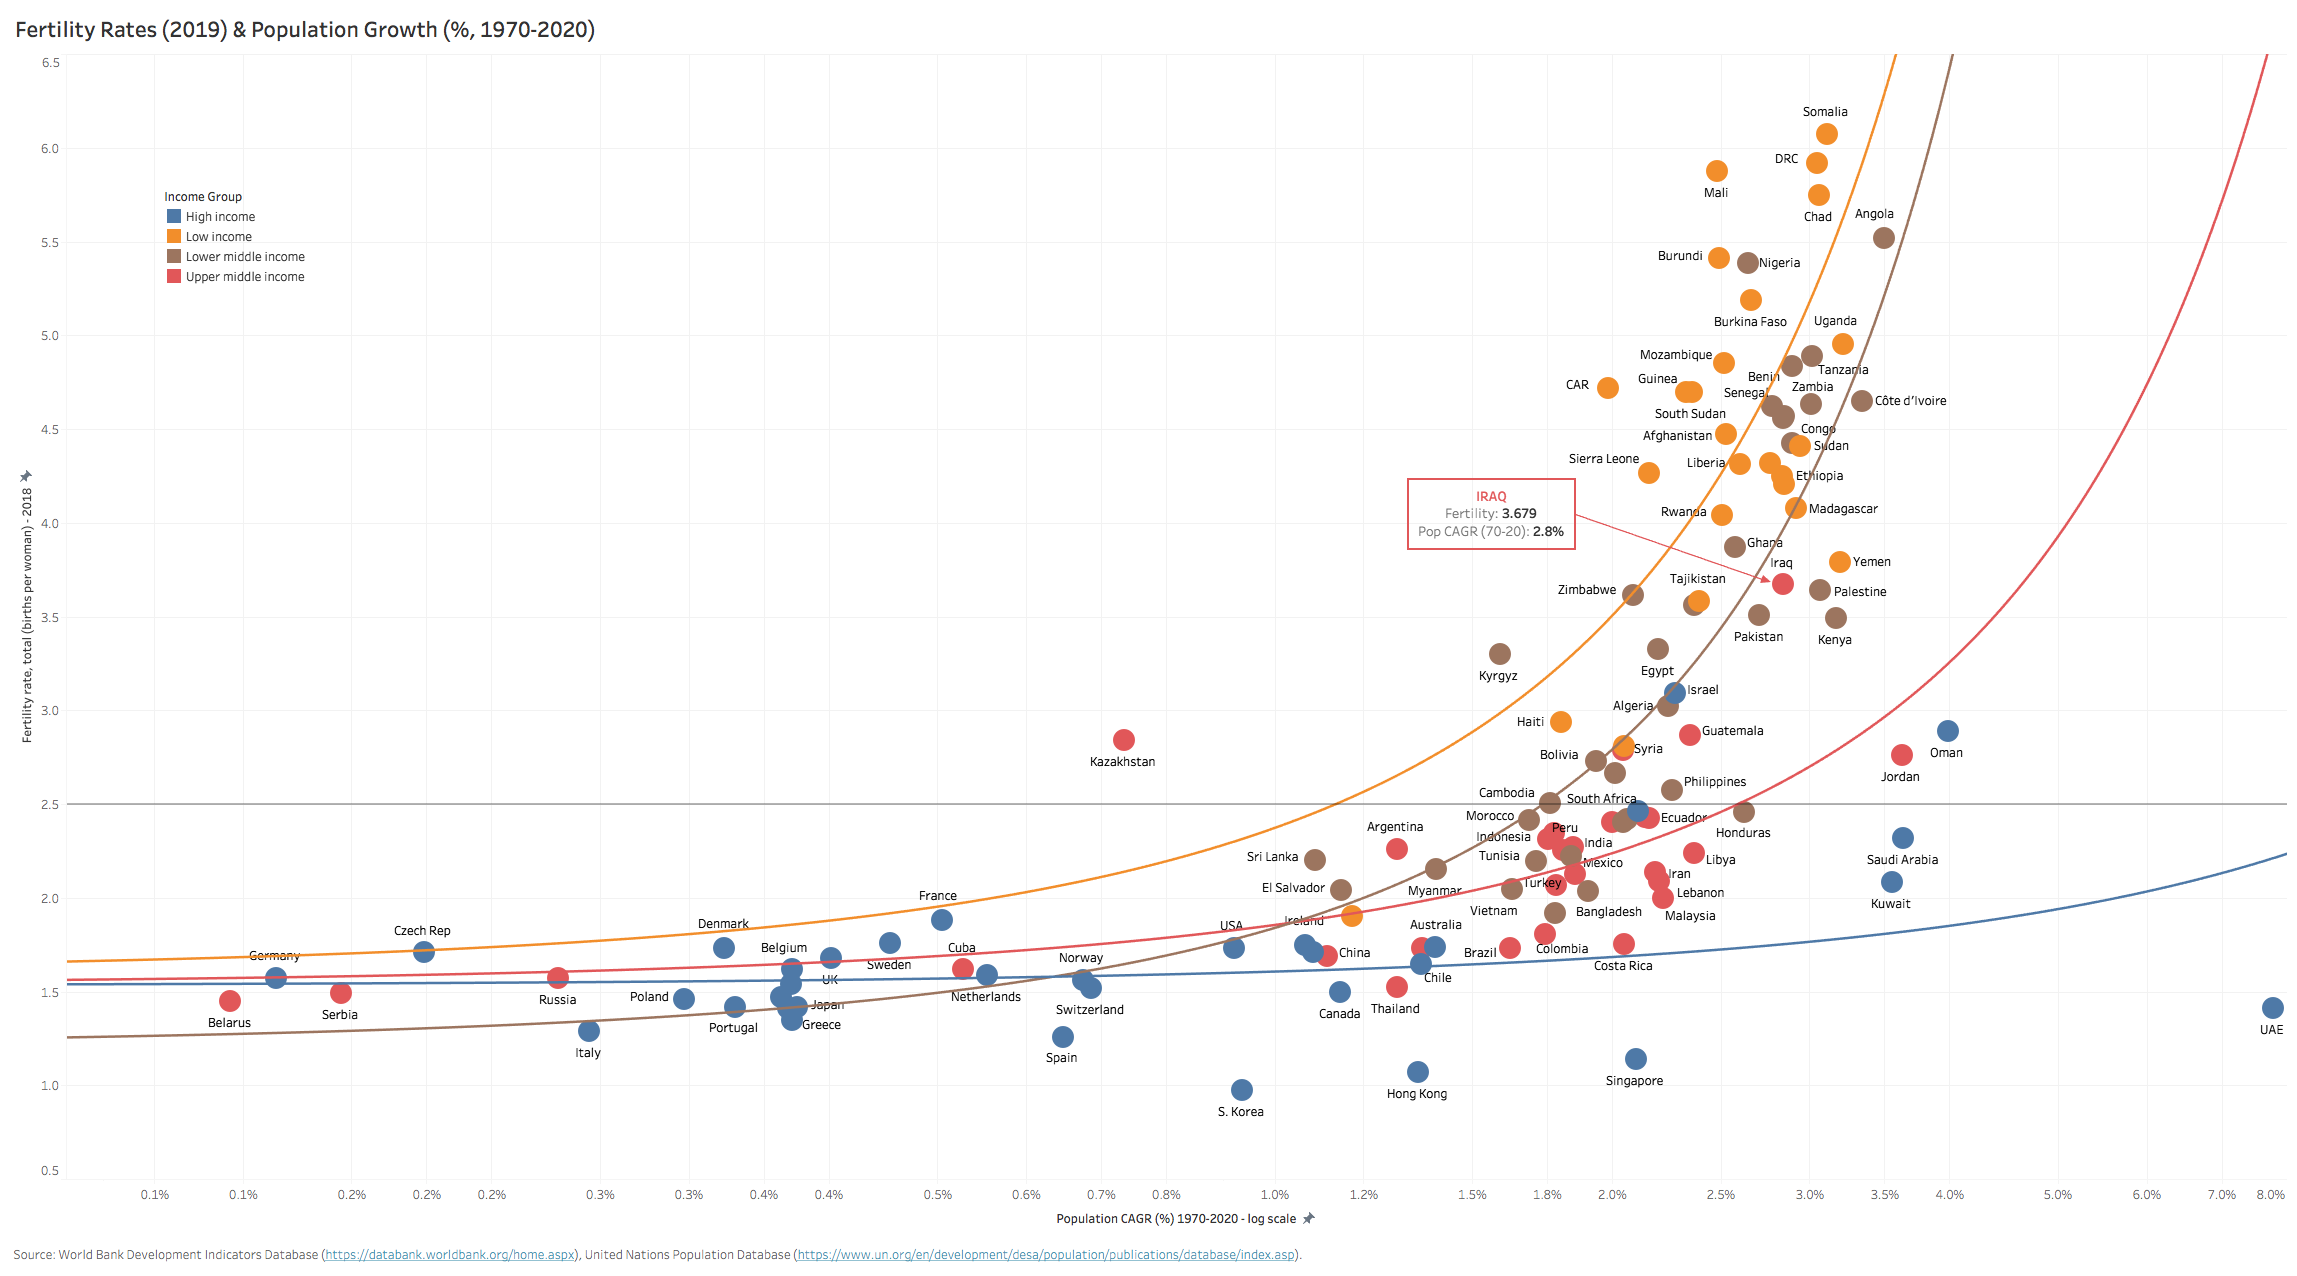
Furthermore, it is important to also take note of Iraq’s unique demographics (Charts 5-9 below). The median age of an Iraqi citizen is less than 20 years old (38% are below the age of 15, 65% below the age of 25). So, the majority of Iraqis were born and grew into adulthood during a time where instability and crisis was the norm. Any shift from the status quo would be a welcome departure for young Iraqis (ages 15-24) who command the highest representation in the workforce across Arabia (34% vs. the likes of Egypt at 28%). Due in large part to the demographic boom and youth bulge of the past 25 years, the population has doubled from 20mil to close to 40mil while the country’s age-dependency ratio has fallen from 92% to 70%. Despite this, Iraq still has one of the highest fertility rates of any upper-middle income country at 3.7 births/woman, a level that is more in-line with a demographic curve of a low-income African nation. As urbanization rates rise (from 70% to 80%+) and population growth slows down, more Iraqis are entering the workforce and the aspirational consuming class – a huge anchor for productivity growth if they are provided jobs. Finally, the generation of Iraqis that is older than the country’s new prime minister (those 65 or older) currently account for less than 3.5% of the population. This tiny minority is aging, spent and gradually retiring or leaving the scene over the next decade. The future of Iraq is simply no longer theirs to claim.
Chart 5: Iraq Demographics (1973-2019)
Chart 6: Fertility Rates Worldwide vs. Population Growth (1970-2020)
Chart 7: The Youth Bulge in MENA (1950-2050F)
Chart 8: Working Age & Older Populations Across MENA (1950-2050F)
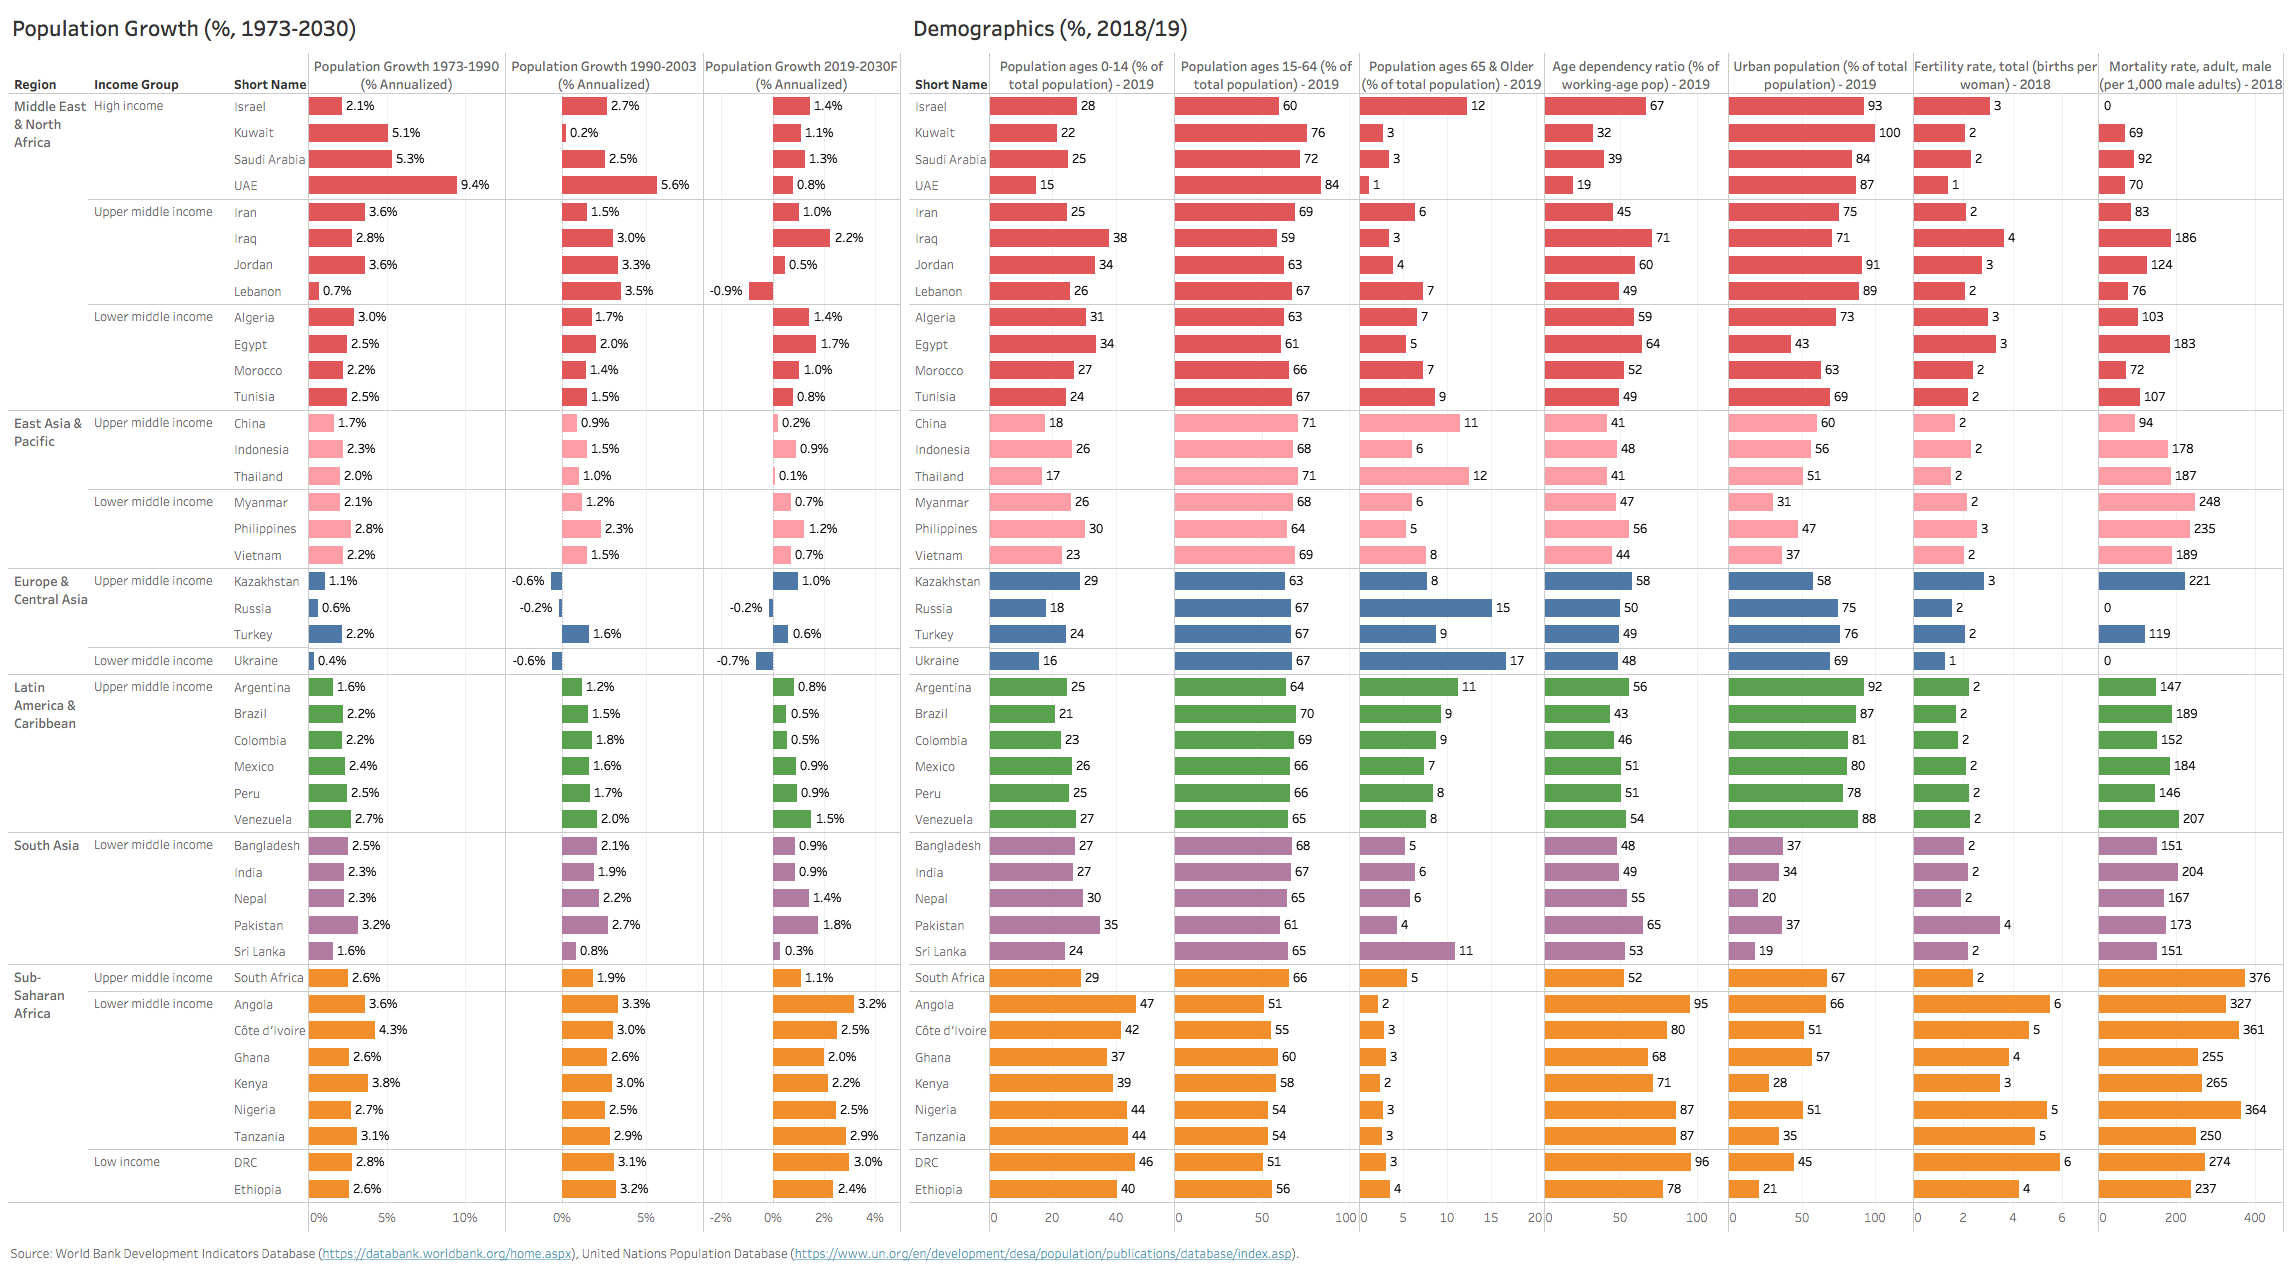
Chart 9: Population Growth & Demographics Benchmarking (1973-2030)
Security & Perceptions of Governance
Despite the improved security situation in Iraq since the aftermath of the 2003 post-war conflict and the 2014-2017 ISIS insurgency, deep ethno-sectarian fissures remain, ISIS’ re-emergence continues to be a lingering security threat and the deep-rooted influence of Iran and its local militia-backed proxies continue to be potent destabilizing factors. We view these threats both as prominent risks, but also as strong anchors for the reinforcement of the federal security apparatus and continuing police and security force reform. Khadhimi’s intelligence background and leadership in defeating ISIS is a major asset here as well. The lessons from 2010-2014 when the security apparatus was neglected and pillaged by the Maliki-led government, only to be over-run by a small ISIS insurgency force are still front of mind for all Iraqis.
With the security threats dissipating somewhat though, past governments’ excuses for poor reform performance begin to fall apart. Emma Sky, in a recent interview, describes the “weird symbiotic relationship” between terrorist threats like ISIS and corrupt politicians: “each claimed to save their people from the other. Now that the security threat has come down, there is no longer an excuse from politicians not to be delivering services….If the government fails to reform, then it becomes more difficult to point to scapegoats and excuses.” Reducing the ISIS threat in a sense has fortified the strength of the reform anchor and forcibly aligned the incentives of government and the people.
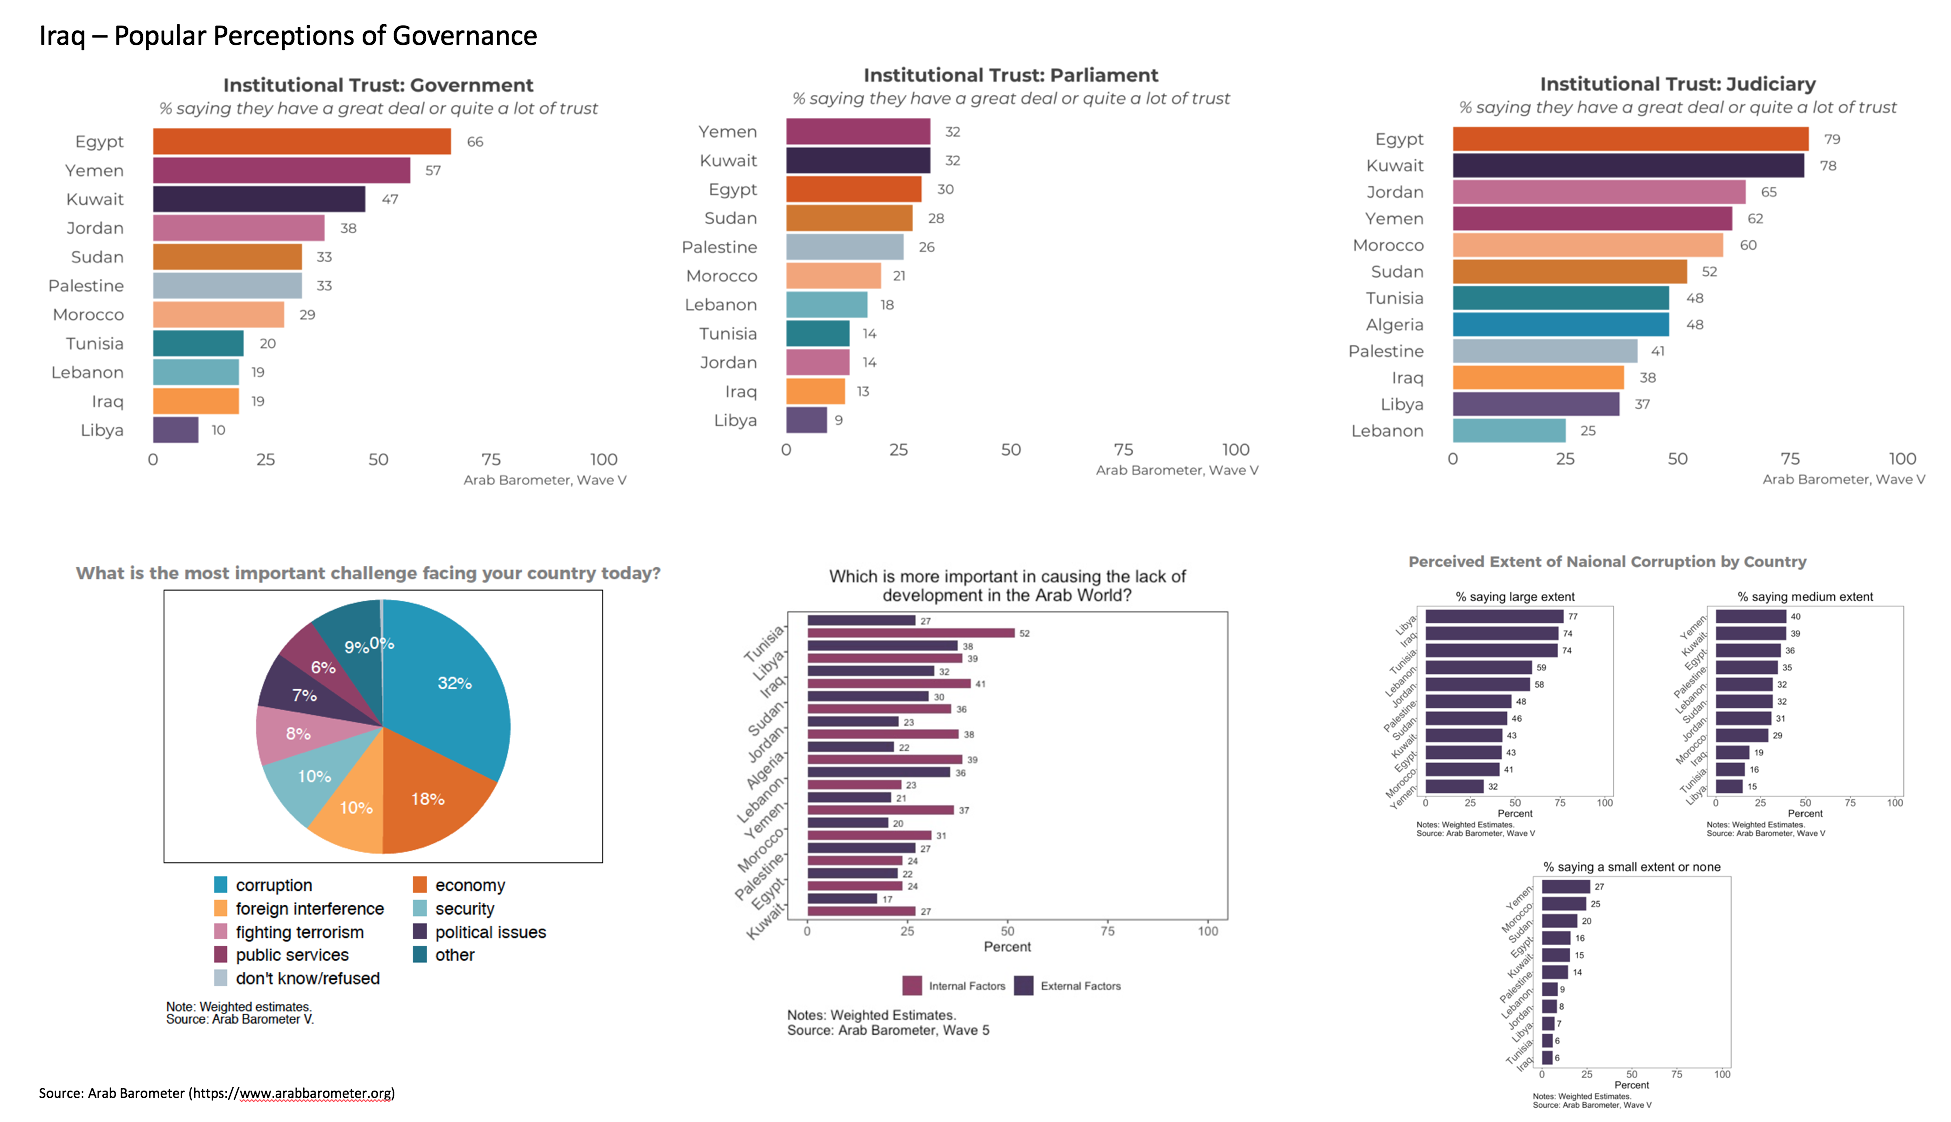
Finally, what gives us the most conviction for expecting important change is that the younger Iraqi generations are now speaking up and expressing their deep distrust of past governments. Recent polling by Arab Barometer in 2019/20 is testament to these trends (Chart 10 below). Only 19% of Iraqi’s polled had trust in the government while a mere 13% trusted parliament (on both counts Iraq is ranked second to last in Arabia, ahead of only Libya). When polled on the most important challenges facing Iraq, nearly a third of respondents named corruption as the leading challenge, with the economy ranking a close second (18%), while both featured notably higher rankings than security (10%). The majority of Iraqis also attribute the leading cause of poor development to be ‘internal’ vs. ‘external’ – in sharp contrast to other fragile states like Lebanon where external factors have a much higher attribution.
Chart 10: Iraq – Popular Perceptions of Governance
Chart 11: Iraq – Popular Perceptions of Governance
On a general perception of national corruption, 74% of Iraqis polled believed that corruption plays a large role in everyday life. Chart 11 above shows a snapshot of recent polling conducted by a local pollster (Mustakella, 2019) which echoes much of the data from Arab Barometer. Notable here is the trend in sentiment from 2010-2019 of those who believed Iraq was heading in the wrong direction: rising from 45% in 2010 to 75% in 2019. Other notable poll results include: a) 79% of Iraqis do not believe that the May 2019 elections were free and fair, b) only 41% of Iraqis trust religious institutions (down from 80% in 2014), c) only a third of Shia Iraqi respondents believed that Iran remains a reliable partner (down from 75% in 2016), d) 74% of Iraqis believe that they are not treated equally with other citizens in their country, and e) an overwhelming majority (76%) of Iraqis supported the protests of 2019. Contrast these polling results to the ethnic, religious and sectarian profile for Iraq discussed earlier, and the gravity of the situation starts to become clearer.
In light of this snapshot of popular sentiment, the October 2019 demonstrations should not have been surprising to onlookers. They reflect loudly the alarming levels and trend of negative perception of governance in the country. Iraq reached its metaphorical boiling point in 2019/20 as a result and this in turn catalyzed political change. But as with past Arab spring uprisings, the ultimate outcome remains risky and deeply uncertain.
ECONOMIC TRANSITION
Pre-War Economic History
The historical economic picture for Iraq, for most of its modern history prior to the exploitation of its oil resources in the 1970s, moved largely in tandem with the volatile and noisy political backdrop (reference Table 1 & Charts 1 & 2 above for a chronology of key events). After independence from British colonial rule and through several revolutions, countless coups, experiments with Nasserist-style socialism, pan-Arab federalism and Iraqi nationalism, the country was never able (nor stable enough) to pursue broad and deep structural reforms and the institution-building that is a natural by-product. As a result, Iraq never really managed to ground itself in a sustainable economic policy framework for the better part of eight decades. Similar to many Arab countries’ experiences during the post-colonial period, Iraq’s history is full of missed opportunities and unclaimed potential.
This disappointing outcome was particularly the case in the period directly after independence from Britain in 1958 when Iraq untethered from the Sterling area and lost its colonial anchor of governance. In the subsequent years before oil became the economic engine for Iraq’s rentier state (beginning in 1973 after the oil sector was nationalized), Iraq’s economic performance for the better part of the period of 1958-1973 was decent, with episodic bouts of growth mainly derived from higher oil revenues which began to accelerate in the mid-1970s.
According to HBS’s Fabbe, “Growth in government spending, particularly for the military, accelerated [only] by the late 1960s, but oil revenues permitted Iraq to incur minimal levels of foreign and domestic debt.” Frank Gunter, a Lehigh University economist and retired US marine that worked for the coalition in Iraq from 2005-2009, surmised that “from 1950-1979, there was a steady rise in per capita incomes…the latter years [distinguished] by the highest living standards ever achieved by the Iraqi people.” This was despite an almost tripling in Iraq’s population (7mil to 21mil from 1960-1979), but obviously flattered by the sharp rise in oil prices in 1979-80. Income per capita (real US$) rose from sub-$500 in 1973 to just shy of $2,000 by 1978, propelled almost exclusively by rising oil rents that reached as high as 65% in 1974. According to Gunter’s own calculations, in PPP terms, Iraqi per capita income was estimated to have risen to nearly $20,000 by 1979-80 more than doubling from the early 1970s.
On the structural front however, apart from the short stint shortly after the 1958 revolution (1958-63) when important economic reforms were pushed through by the Qasim-led “Iraq First” populist/nationalist policies, this three-decade period of post-colonial rule was in retrospect, a lost era. Iraq adopted little if any industrialization or productivity-enhancing policies. Qasim was overthrown in a 1963 bloody coup, and most, if not all, of his laissez faire policies were abandoned in favor of state nationalizations and the precursor for the hollowing-out of the private sector (1964 saw 30 leading industrial firms and all the private banks and insurance companies transferred to public sector ownership). This also ended up effectively weakening the entrepreneurial class in Iraq. According to Al Nasrawi, all of this was done under the banner of ‘social justice’ and to align Iraq more closely to the disastrous Egyptian-Nasserist socialist model ahead of a planned federation with Egypt & Syria.
Towards the late 1970s however, but well before the Baath party began to weaken the entrepreneurial environment with a system of party favoritism and before Dutch disease fully set in and inflated the dinar, Iraq was only a minor exporter of food and boasted only a meager industrial base that was built on the foundation of import substitution. The planned union with Egypt never materialized when the Baath party rose to power in 1968 as it adopted an explicit strategy of establishing a nationalist, socialist economic system – thereby shrinking the private sector even further. By the early 1980s, and with oil revenues fueling the growth of state-owned enterprises (SOEs), which by then controlled all manufacturing and trade, the public sector overtook the private sector in size. Despite a rushed privatization drive that was instituted in the mid-1980s to shore up reserves due to the expensive war with Iran, the Iraqi private sector never really recovered from past decades’ debasement.
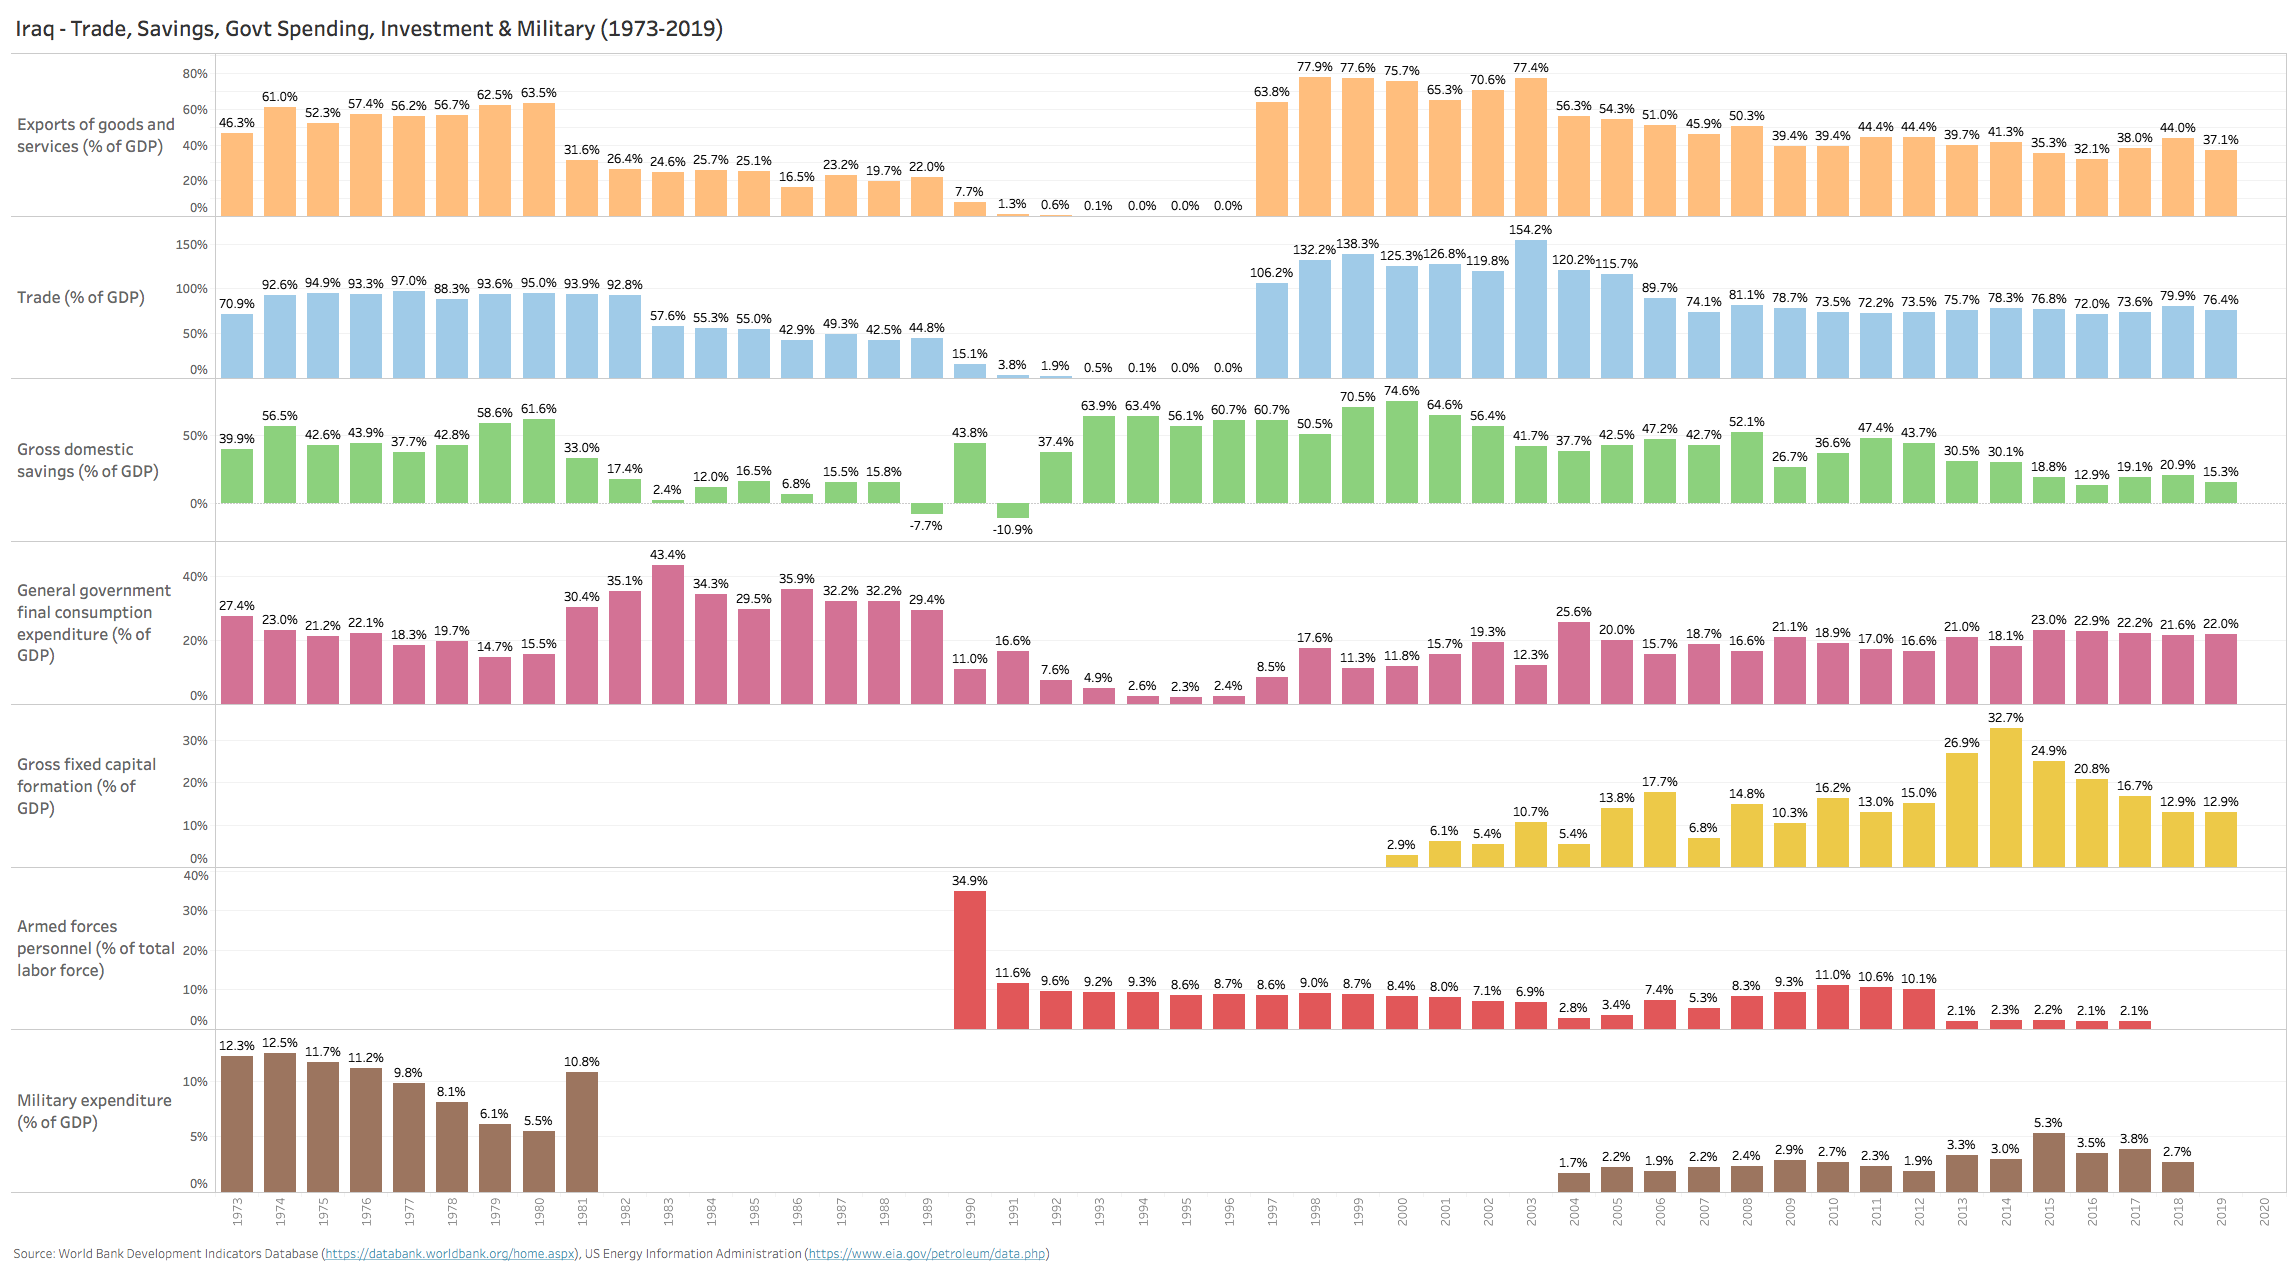
With the largesse of oil rents that ensued after 1973, Iraq experienced an impressive expansion of the state apparatus, fueling massive government spending on arms and infrastructure. The Baath party also spent heavily on healthcare, education and large state subsidies, though most of the recipient sectors remained dominated by SOEs. Public investment to GDP was as high as 27% in 1973, though the ratio of private to public investment declined in the 1970s as the state expanded the scope of its activities. By the mid-1970s, Iraq’s defense spending grew to account for the majority of the government budget (from $3.1 billion in 1975 to $20 billion in 1980 or 39% of GDP). The period ending in 1979 also marked the peak in real per capita income (PCI) at the time, with PCI nearly reaching $4,000 per person in 1980, a 35% annualized growth rate vs. 1973 (despite very high population growth of 3.2%) and over 4x the average for middle income states ($700). Chart 12 below with data from the World Bank and US EIA illustrates these trends. According to Fabbe’s assessment of Iraq during this period, “with oil generating more than 95% of export earnings and over 60% of GDP in some years, while absorbing only about 2%-3% of the Iraqi labor force, Iraq became the quintessential rentier state“.
Chart 12: Iraq – Resource Intensity & Per capita Income Growth (1973-2019)
That is essentially Iraq’s pre-war economic picture as we see it. The years that followed, up to the 2003 US invasion, were characterized by huge economic distortions and dislocations, clearly manifested by years of war, internal strife and sanctions. Any long-term economic development plans (e.g. industrial deepening or the launch of a manufacturing base) were subordinated to either the war-time objectives or to circumvent the ensuing sanctions regime. As a result, any semblance of a robust private sector was largely absent, and the informal economy dominated the picture as a result. Testament to this is the fact that manufacturing as a share of GDP fell precipitously from a 1985 high of 9.9% to as low as 1% in 2003, without ever fully recovering since then (see Chart 13 below).
Chart 13: Iraq Sectors as a Percentage of GDP (1970-2020)
We believe this historical backdrop is especially important in order to understand the root cause of the slow pace of the private sector’s revival since 2003. For us, it goes a long way to explaining why various aspects of reform like state bank restructuring have yet to be completed, thereby postponing the full potential of private-sector banking. It also explains the incredibly paranoid attitude towards foreign private investment and why easy obstacles like foreign share custody for stocks as a minor example remains absent in the Iraqi capital market infrastructure. The longstanding historical dominance of the SOE ecosystem in Iraq and the generally apathetic culture towards private enterprise has played a huge role in delaying the broad liberalization of the Iraqi economy.
The Cost of Iraq’s War-Time Adventurism
By the time the bloody eight-year war (1980-88) with Iran was over, due to rampant military spending and huge deficits during this period, Iraq’s debt had ballooned to almost $80bil (50% of GDP), the country virtually exhausted its foreign currency reserves while inflation spiked from 95% in 1980 to 369% by 1988. The collapse in oil prices between 1986-1988 (despite an impressive recovery in production) had meant that oil revenues were only $11 billion, less than half of the 1980 levels and insufficient to continue funding the large patronage system and state subsidies. Iraq primarily financed the war with debt from Saudi Arabia and Kuwait, totaling over $40 billion and made up roughly half their debt of $75 billion in 1989. By this time, about 55% of Iraq’s oil revenues went to service this debt. All in, the Iraq-Iran war had cost the country $453 billion in losses (250% of its cumulative 57-year oil revenues). Add to this Iran’s own losses of $644 billion and the total cost of the war for both sides eclipsed $1 trillion. The numbers are still staggering in magnitude.
The decision to invade Kuwait in 1990 that followed the Iran-Iraq war two years hence was a direct consequence of the war’s painful economic losses and an obvious act of desperation by Saddam Hussein to recover ‘lost ground’ (literally in terms of territory, metaphorically in terms of Kuwait’s oil reserves and capital). The 1991 US-led liberation that ensued destroyed a major portion of Iraq’s infrastructure (military, civilian and oil capacity). In the ensuing 12 months, oil production fell by 86%, imports dropped by 90% and exports by 97%. Hyperinflation set in during this period, reaching 1,000%-2,000% (annual), driving the real value of the Iraqi dinar into a free-fall. The dinar’s longstanding peg to the US$ at 3.2-3.4 IQD/$ (1973-1990) broke down in 1990 into three separate exchange rates with a free market rate that eventually depreciated to as low as 2,000 IQD/$ by 1992 (note: the official dinar exchange rate remained pegged until 2003 and eventually settled at a rate of 1,450 by 2005 and was later revalued to 1,170-1,180 by 2010 as inflation dropped to single digits and foreign reserves built up). By the end of this period, total debt had reached $86 billion (540% of GDP) and foreign reserves were all but exhausted. All in, the Gulf War of 1990-91 cost Iraq an additional $232 billion in damaged infrastructure and economic opportunity cost. Alnasrawi estimated in 1994 that the economic cost of both wars, inclusive of war reparations and accumulated debt to have been as high as $586 billion or 60x Iraq’s 1993 GDP and equivalent to China’s GDP in 1994. This conservative estimate did not include the opportunity cost of lost oil revenues, exhaustion of foreign reserves, lost non-oil output or the massive brain drain that resulted from emigration during this period.
Looking from the perspective of the average Iraqi, the toll was arguably far greater. Both wars cost upwards of half a million Iraqi lives (close to 17% of the labor force at the time) with millions more displaced or wounded. The impact on average standards of living was also incredibly painful. The 13-year period after the UN embargo and sanctions regime took hold pulled the Iraqi real per capita income (measured in current US$s) to nearly ground zero. Several estimates of where real GDP per capita stood in 1995 put it at a mere $250-$450 – possibly below that of rural India at the time. According to Gunter, on a PPP basis, per capita income fell to as low as $2,500 in the early 1990s, translating into a nearly 87% drop from the 1979-80 peak and well below Iraqi average income levels last seen in the late 1950s. This was not surprising as the UN embargo had effectively shut down Iraq’s exports, driving oil export revenue per capita (in real terms) from $2,355 in 1980 to as low as $232 by 1997 (see Charts 1 & 2 above). This decade of war-time adventurism sent the Iraqi economy into a massive financial hole and erased almost 50 years of income growth.
Post 2003 – A New Beginning
Fast forward to the post-2003 period, the hydrocarbon sector was effectively allowed to decouple from the overall economy due to the CPA’s strong emphasis on aggressively resuscitating Iraq’s oil production. The recovery in production and GDP from 2003 to 2020 was nothing short of remarkable, and this occurred despite the political upheaval that Iraq experienced in the aftermath of the US invasion and subsequent civil war, insurgencies and overall governance dysfunctionality. Oil production rose from 1.3mbpd to nearly 4.9mbpd by 2019 (an all-time record), while GDP per capita went up by a factor of 11.5x (from $616 in 2003 to over $7,000 by 2013 – though still shy of Gunter’s estimate for Iraq’s PPP peak in 1979). Household spending, although recovering swiftly from the 2003 lows, exhibited a flatter slope ($265 per capita to $3,400 in 2013), while oil export revenue per capita actually began to stagnate and then fall by 2016. This divergence is due to both: a) high and rising population growth rate (averaging close to 3% during this decade and reaching as high as 3.9% in 2013; Iraq’s population added 7.6mil during this period – a 30% rise) and b) the reality of weaker and more volatile consumer sentiment during much of this recovery period.
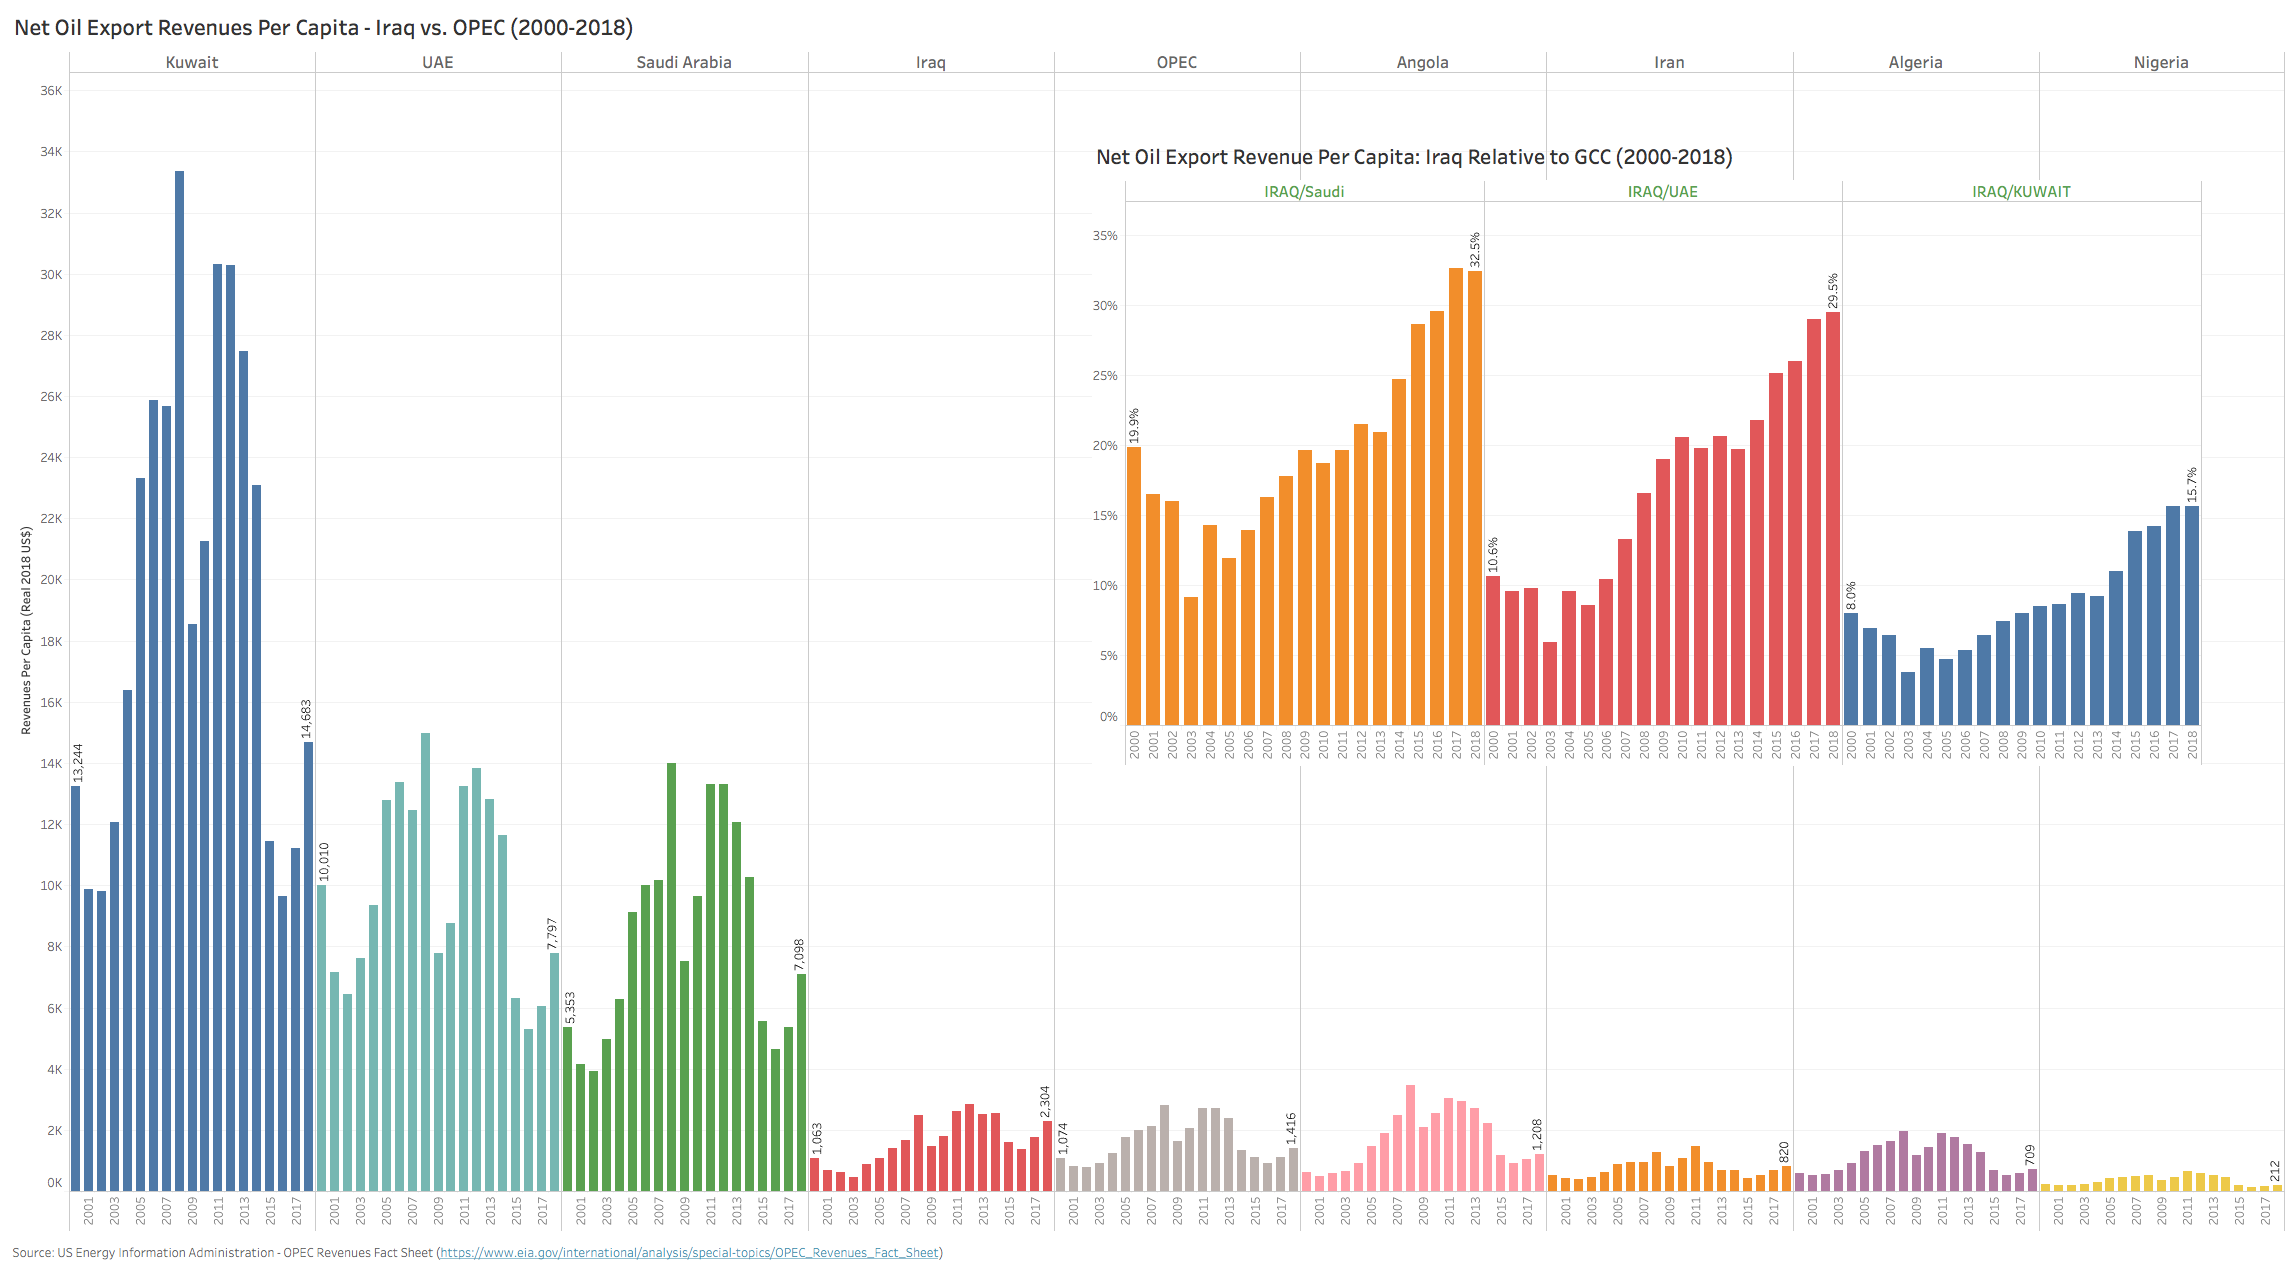
While the lackluster recovery in consumer spending is not surprising due to an unstable security environment and the slow ramp-up of core infrastructure rehabilitation (the chronic power sector deficit is a prime and noteworthy example which we discuss later in the note), the fall in per capita oil export revenues is however an area of structural concern. Unlike the GCC states or many of its OPEC peers, Iraq continues to punch below its weight when it comes to oil revenues per capita, with less than a third of Saudi’s average and only 16% of Kuwait’s (Chart 14 below). If Iraq continues to be a ‘one-trick-pony’ in terms of its extreme reliance on oil revenues (60% of GDP, 92% of government revenue and 99% of exports), per capita oil revenues will need to at least rise above population growth (2.3%) in order to just maintain the current standard of living. During oil shocks like the one being experienced in 2020, the expected impact to the budget is material, with a projected deficit of 23%-29% in 2020 (assuming a fiscal breakeven oil price of $60/bbl) and a shortfall in covering just the $52 billion of public sector salaries and pensions alone (see Chart 15 below).
Chart 14: Net Oil Export Revenue Per Capita – Iraq vs. OPEC (2000-2018)
Chart 15: Iraq – Revenue, Deficits & Non-Oil GDP (2005-2021) – IMF
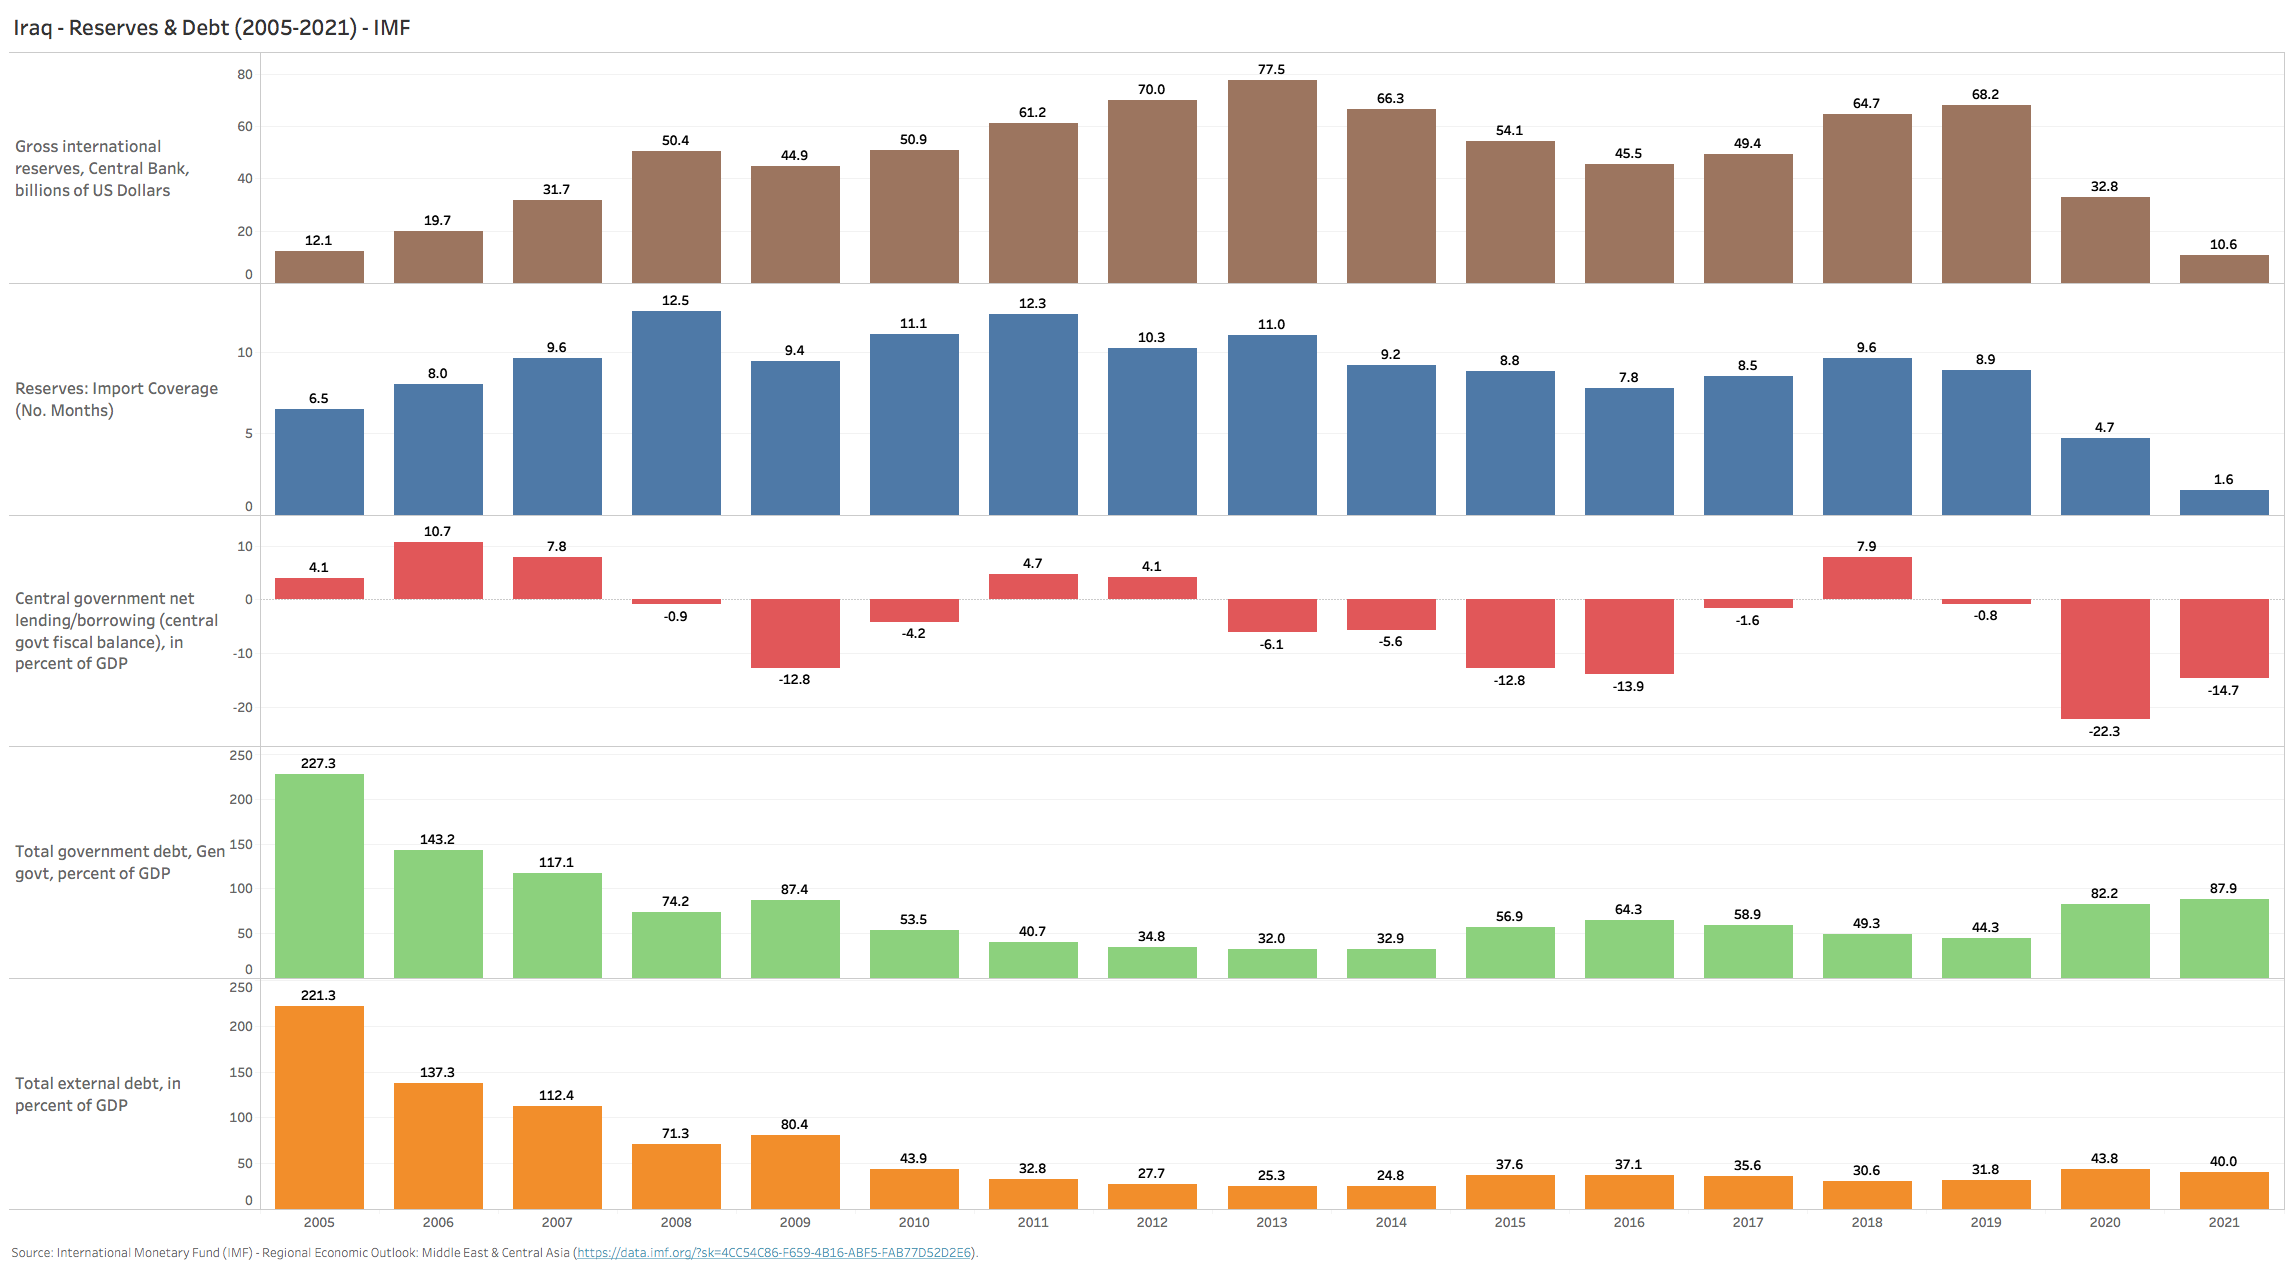
Finally, the IMF expects international reserves to more than halve in 2020 ($68bil to $33bil) with import coverage dropping to a dangerous 4.7 months (1.6 months in 2021). A sharp rise in government borrowing will be needed to plug these massive funding gaps, with total debt to GDP expected to nearly double (44% to 82% – Chart 16). With non-oil GDP growth expected to be down as much as 9% in 2020 vs. oil GDP contraction of 2.3% (IMF projections), there will be little support from the moribund non-oil economy. This seriously calls into question Iraq’s production cut commitments to OPEC in 2020 and beyond. If there ever was a need for more hard evidence to support diversification away from hydrocarbons, 2020 is one heck of a wake-up call.
Chart 16: Iraq- Reserves & Debt (2005-2021) – IMF
Iraq’s Resource Curse
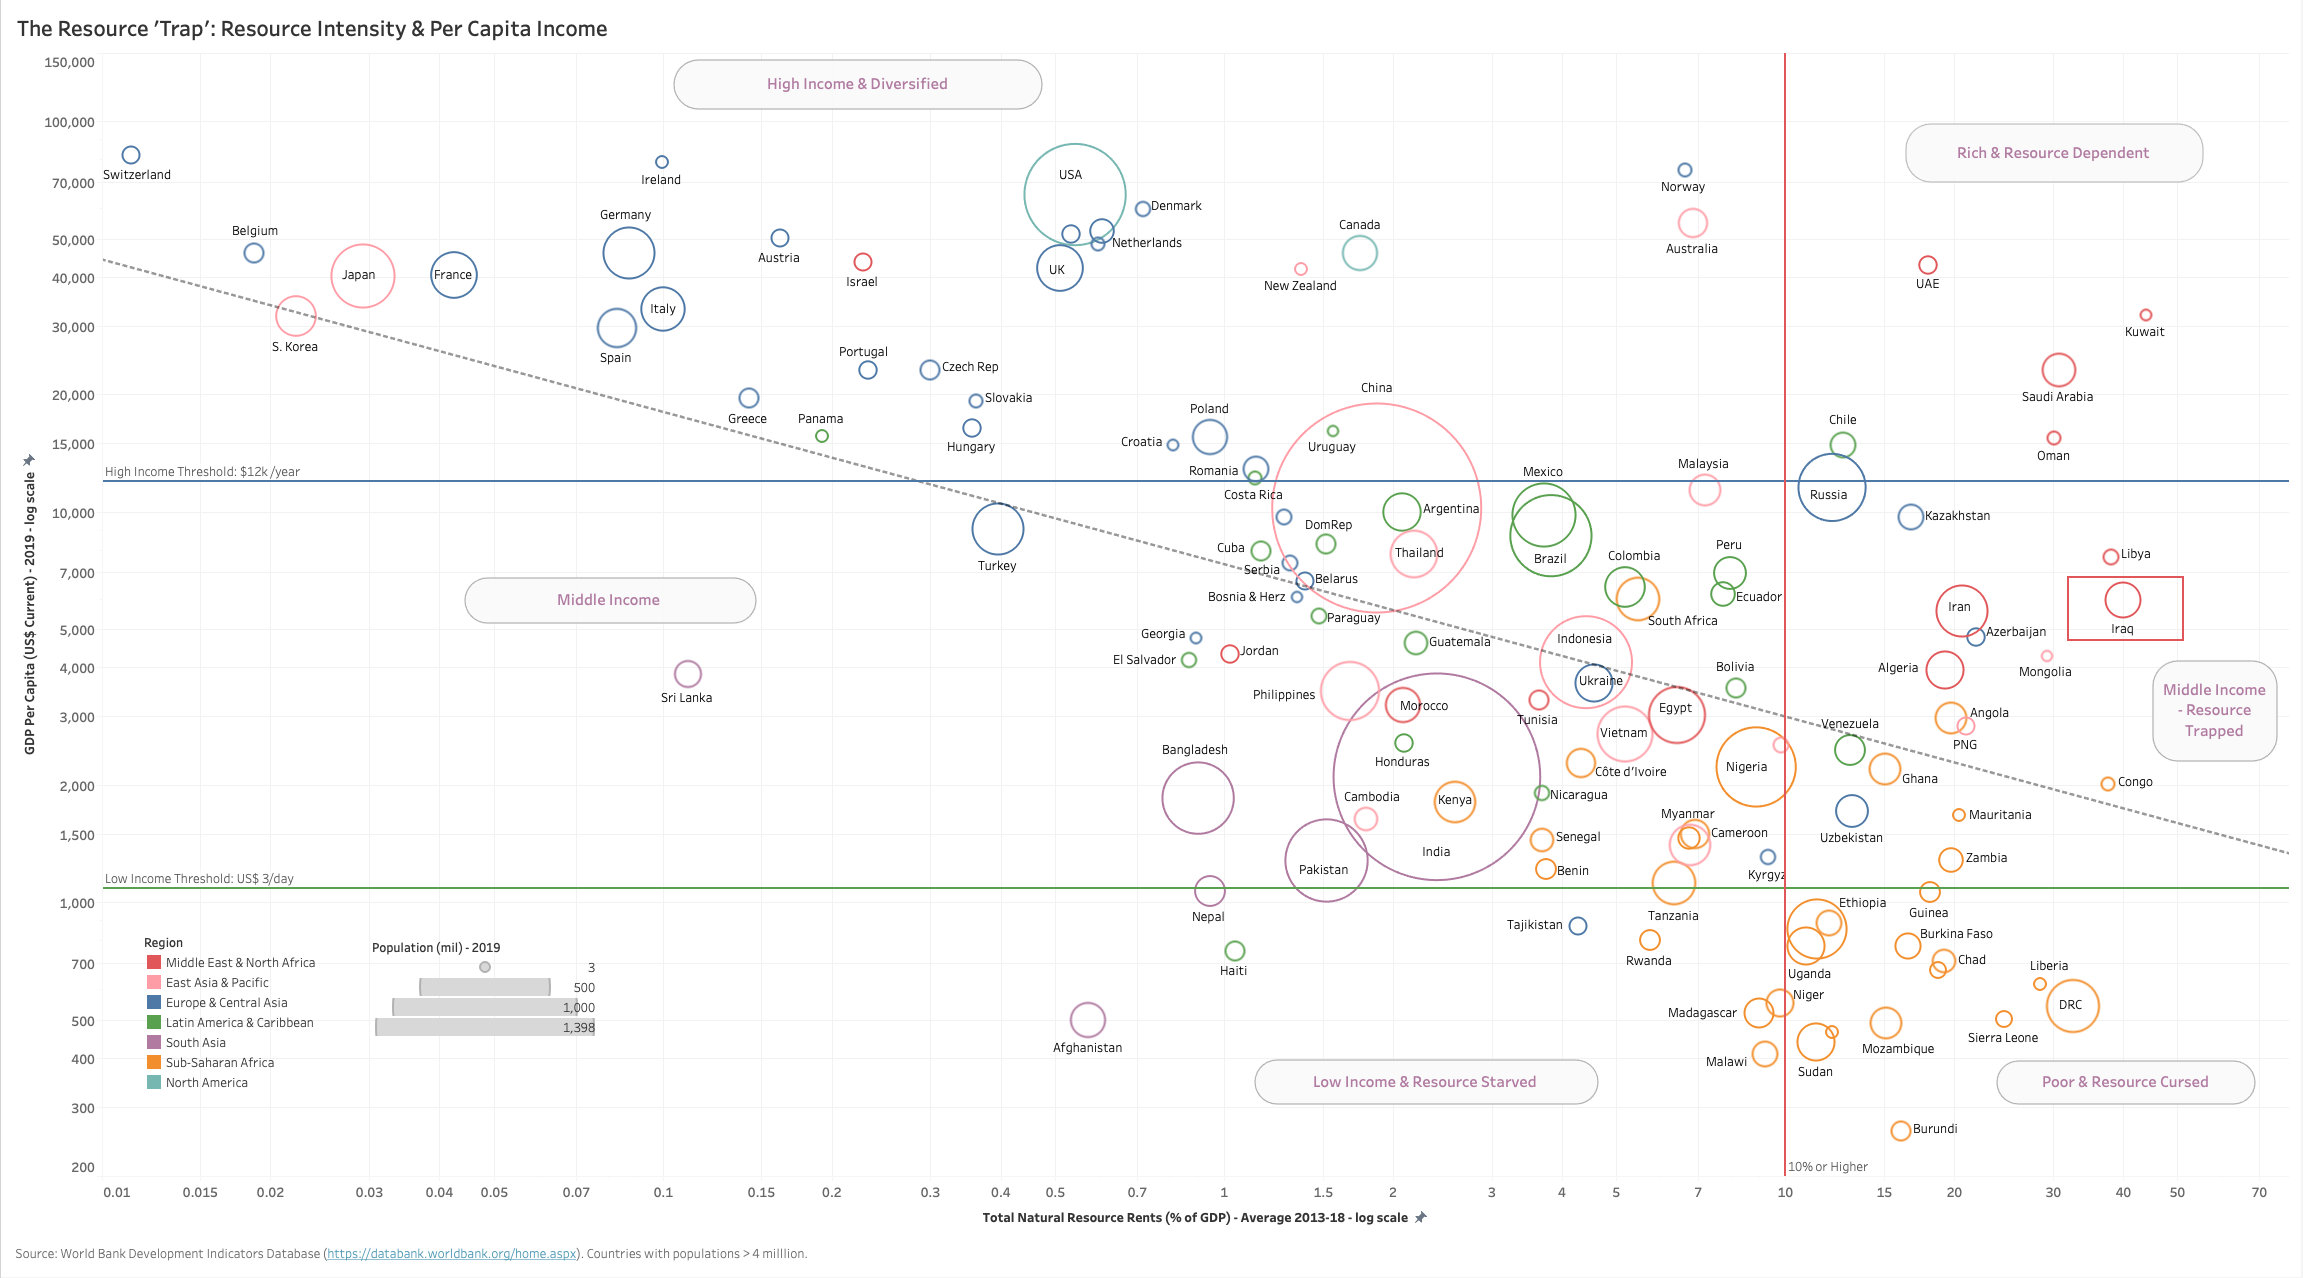
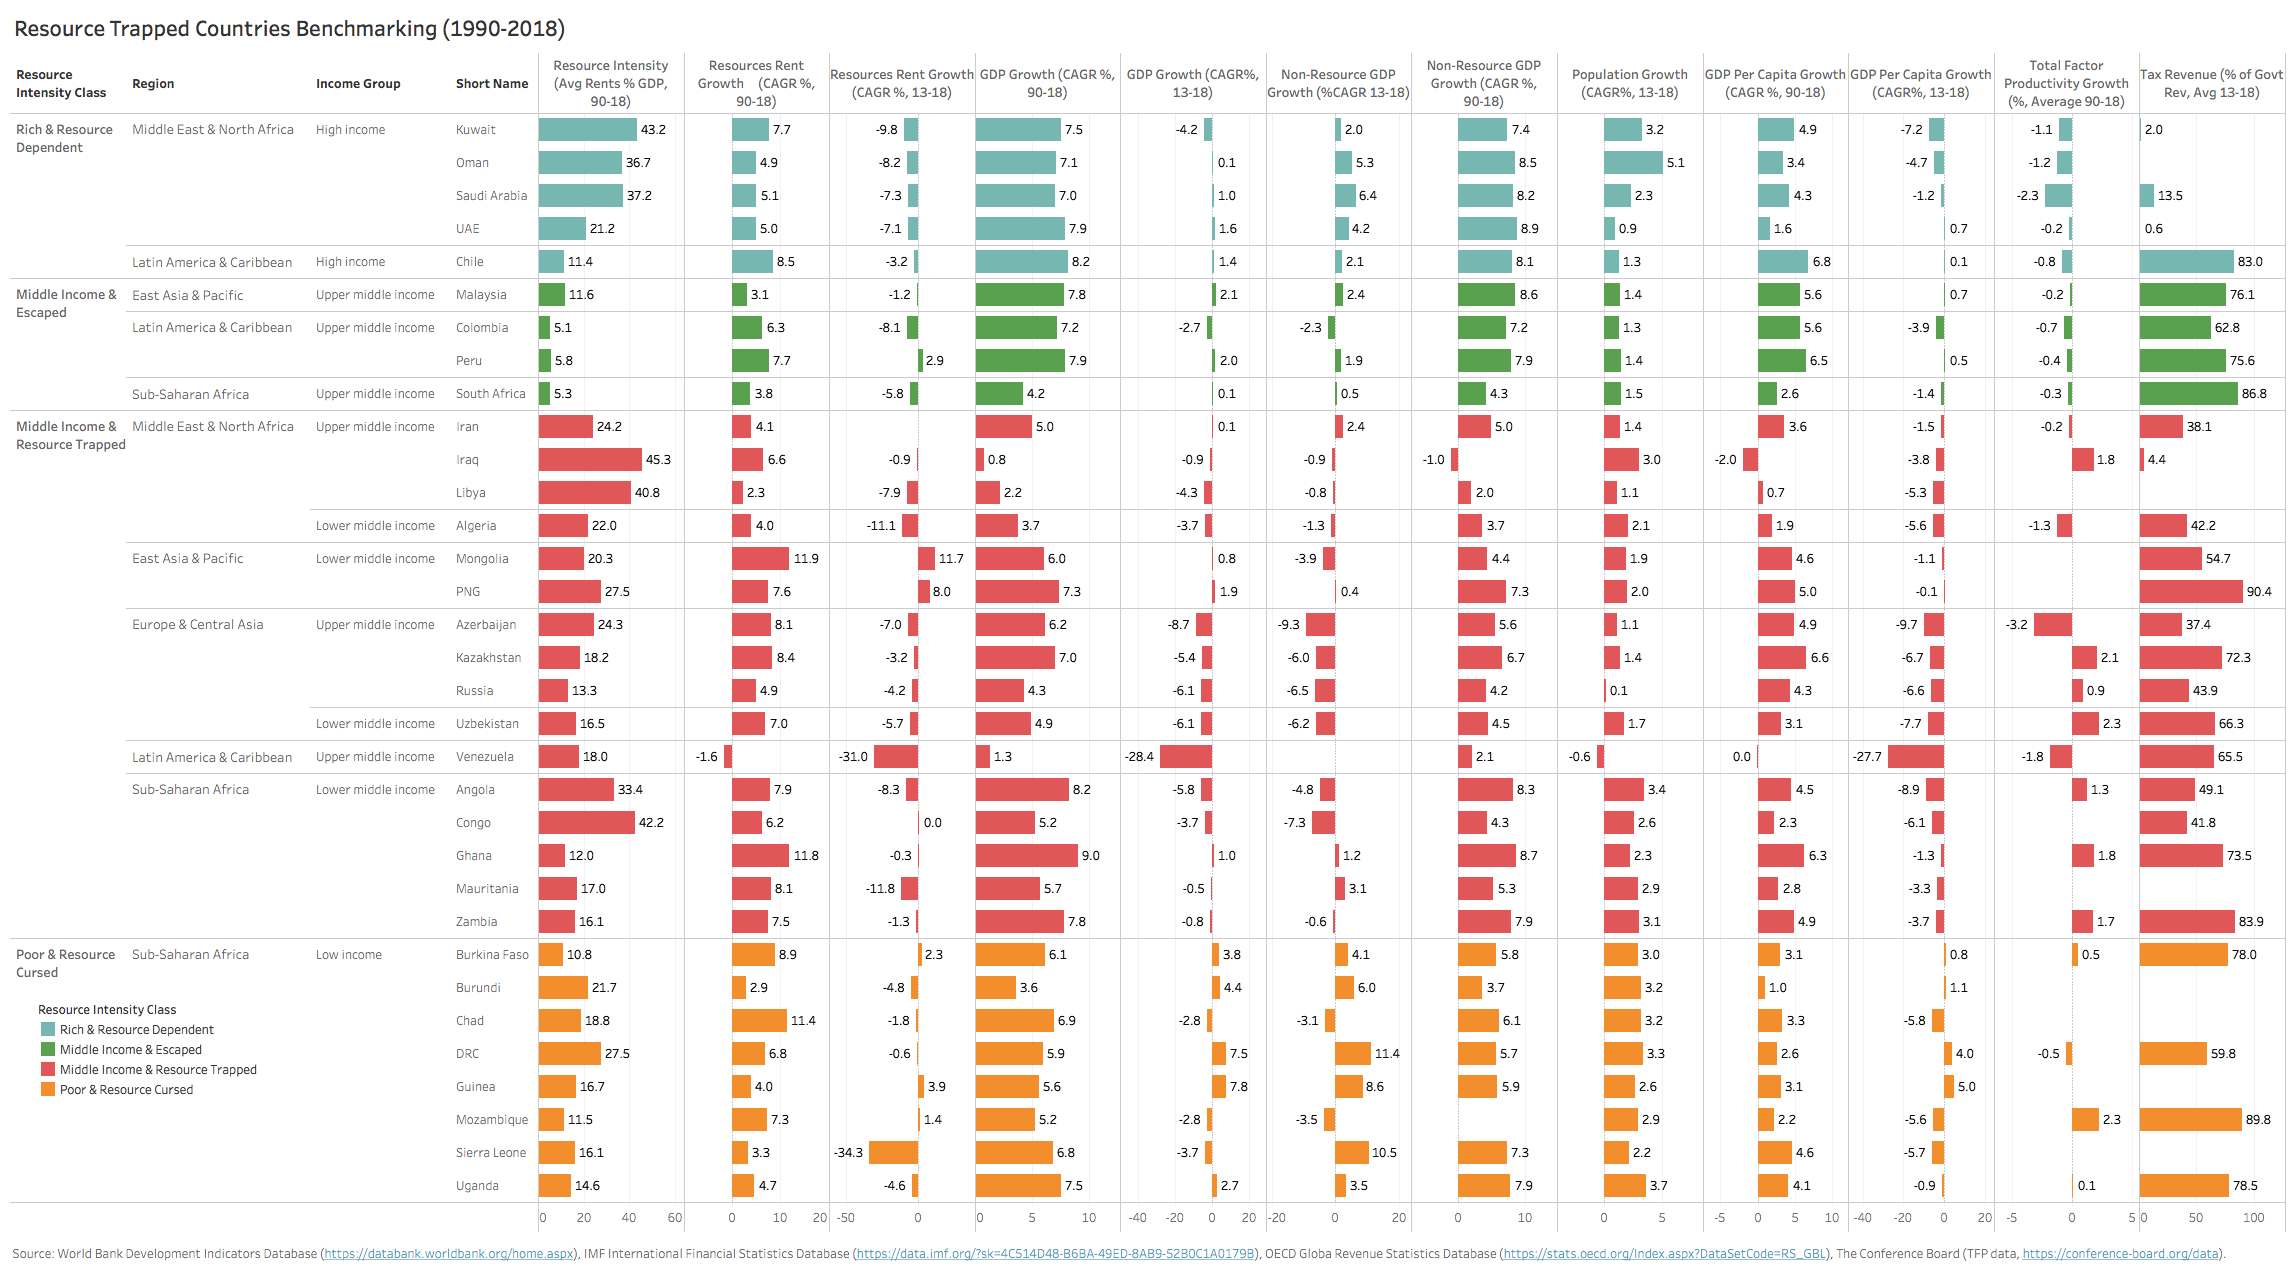
The further intensification of Iraq’s oil dependency that resulted during this period (post 2003 resource rents as a percent of GDP declined from a staggering 64% in 2004 to 46% by 2018, during a time where Iraqi GDP rose by a factor of 6.5x and compounded at over 13% in real terms), cemented Iraq’s place in the quadrant economists call the ‘Resource Trap’ (Chart 17 below). If you look at the middle-income countries that accompany Iraq in this unflattering group (Iran, Algeria, Libya, Azerbaijan, Kazakhstan, Uzbekistan, Mongolia, Papua New Guinea, Angola, Ghana, Mauritania, Zambia, Congo and Venezuela – red bars), several commonalities emerge when looking at a multi-decade growth profile (1990-2018; see Chart 18 below for a benchmarking of this group).
Chart 17: The ‘Resource Trap’: Resource Intensity & Per Capita Income (2018/19)
Chart 18: ‘Resource Trapped’ Countries Benchmarking (1990-2018)
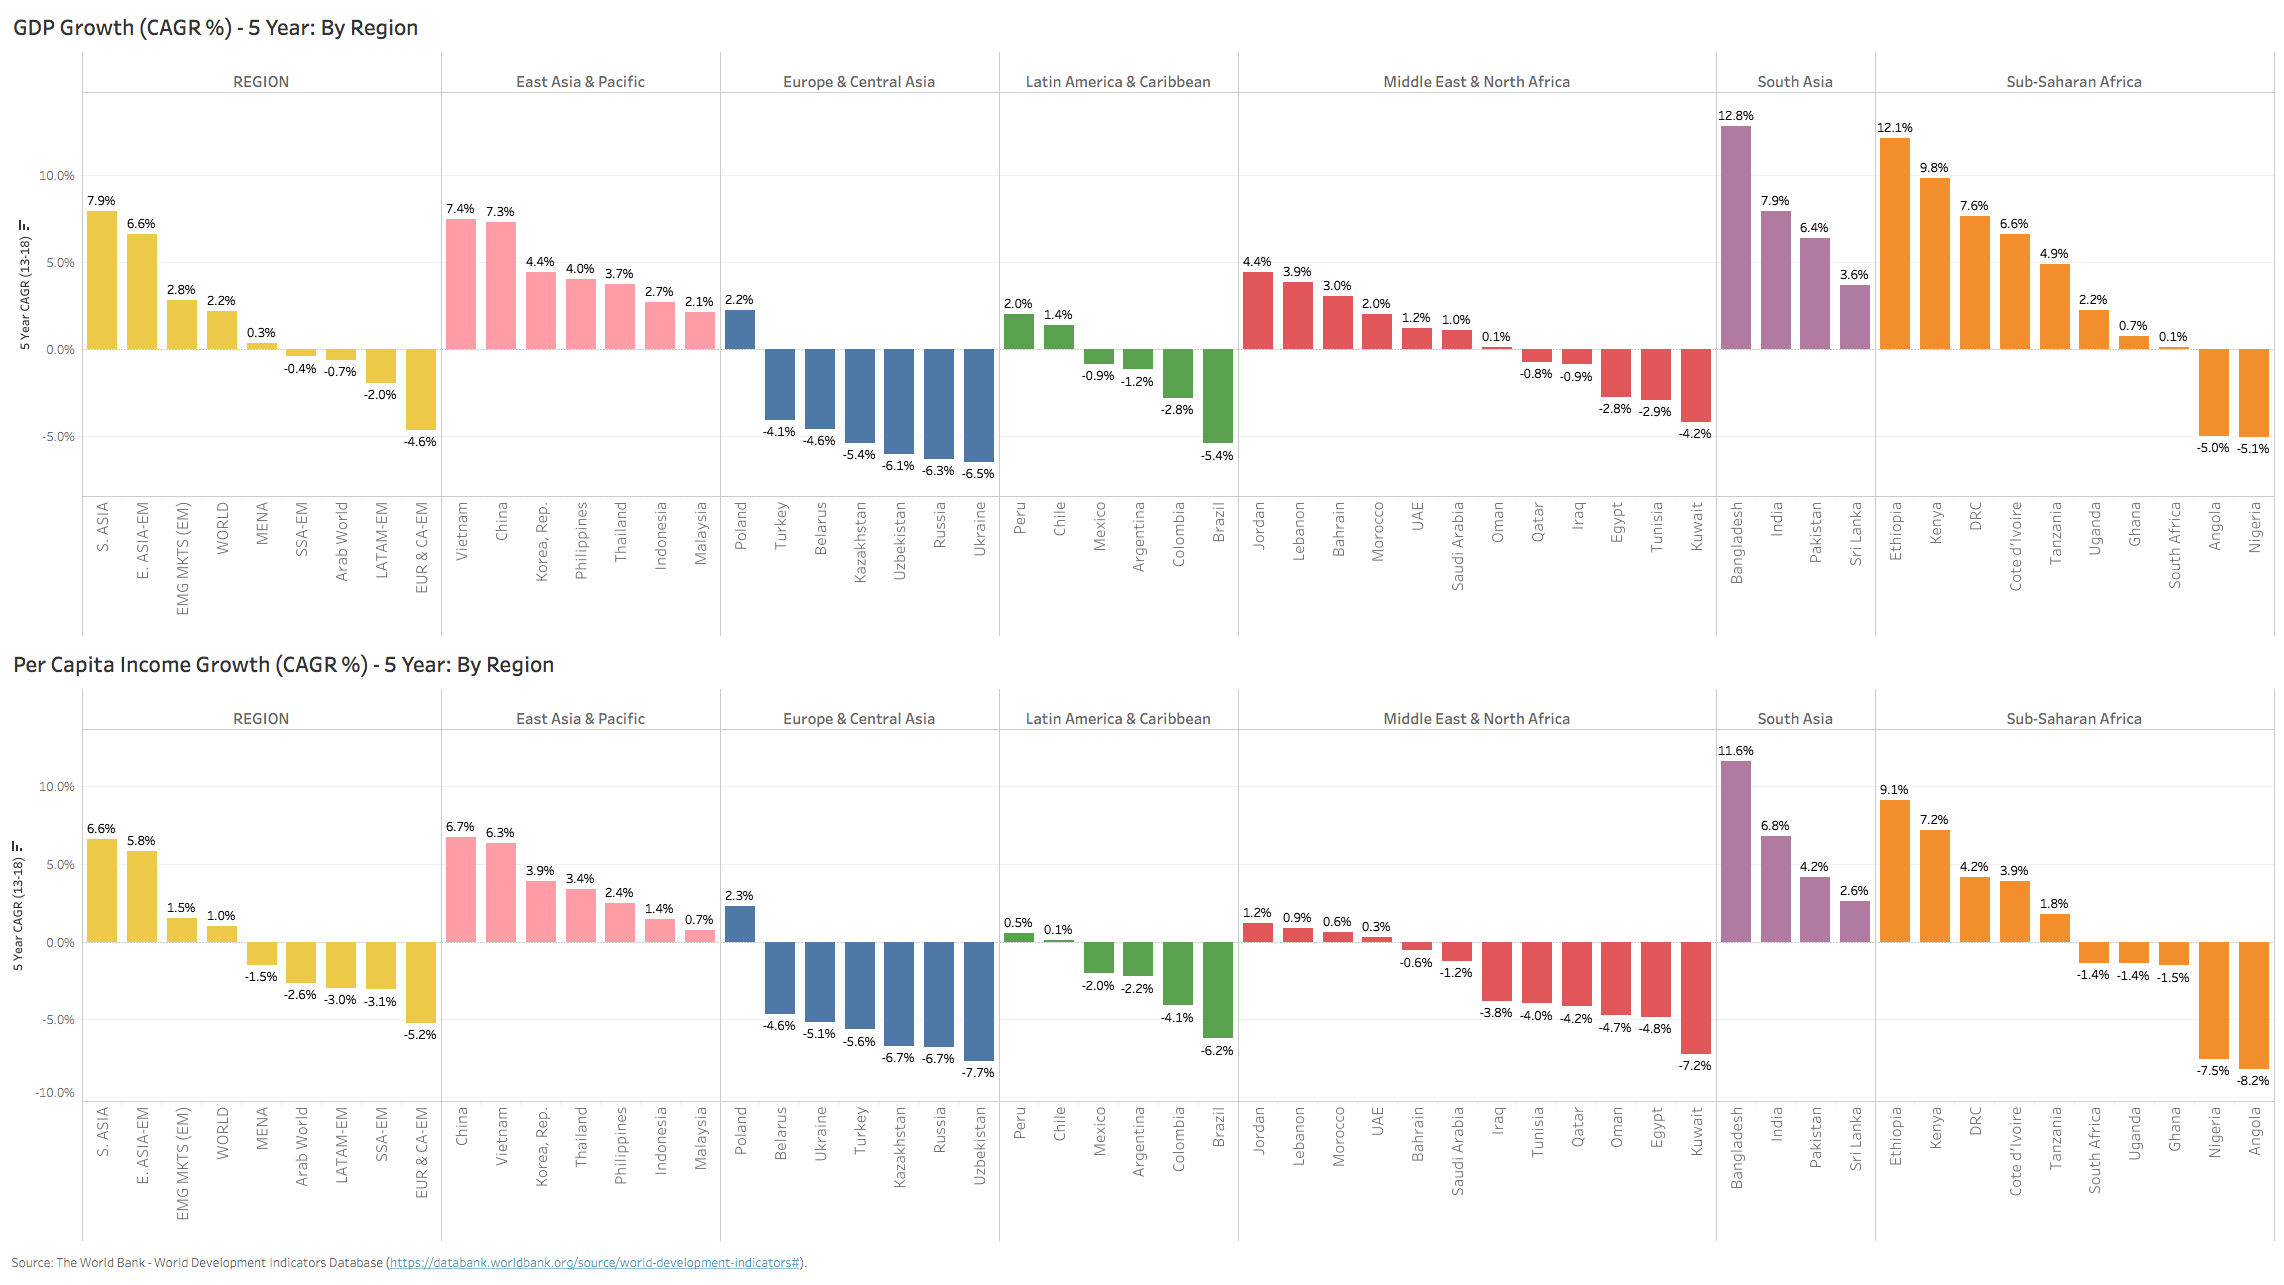
Most of the three-decade growth for the majority of countries in this group can be attributed to the resource sector, with resource-rent growth in most cases eclipsing overall GDP growth (in some cases like Iraq & Venezuela, the differential is quite large). This is also reflected in non-resource growth rates that are almost unanimously below overall GDP growth rates (Angola is the lone exception). Pull forward to the last five years (2013-2018) during a period of weaker commodity prices and the effect of the resource curse is evident in negative (> -5% for many) GDP growth rates for almost all of the ‘trapped’ peer group, with an even more pronounced contraction in the non-resource sector for most.
If we then look at the ‘trapped’ group relative to those countries which managed to ‘escape’ the resource trap in recent decades (e.g. Colombia, Peru, South Africa – green bars), the impact on non-resource growth, even in the 2013-18 period, was more subdued. This is due in large part to their diversification strategies where resource-rent intensity declined materially (in Colombia’s case it fell from 7% to 5.5%, Peru’s dropped from 15% to 9% and South Africa’s from above 11% to 6%). As a result, these countries far outperformed the ‘trapped’ group in terms of non-resource growth, volatility of growth in general and ultimately long run per capita income growth.
Finally, a note on the ‘Rich & Resource-Dependent’ group (turquoise bars) which consists of the GCC countries (Saudi Arabia, Kuwait, UAE, Oman), Chile and Russia (the latter straddles the ‘rich/resource-dependent’ and ‘trapped’ groups). Here, the paradox of plenty manifests itself in similar GDP growth volatility as their middle-income peers, but with meaningfully lower productivity growth rates, especially for those countries which adopted aggressive migrant labor import models (GCC) or primarily utilized higher factor inputs to drive overall growth. All of these rich countries, without exception, have large foreign savings, reserves or un-levered balance sheets that they are able to draw upon in order to finance counter-cyclical fiscal policies.
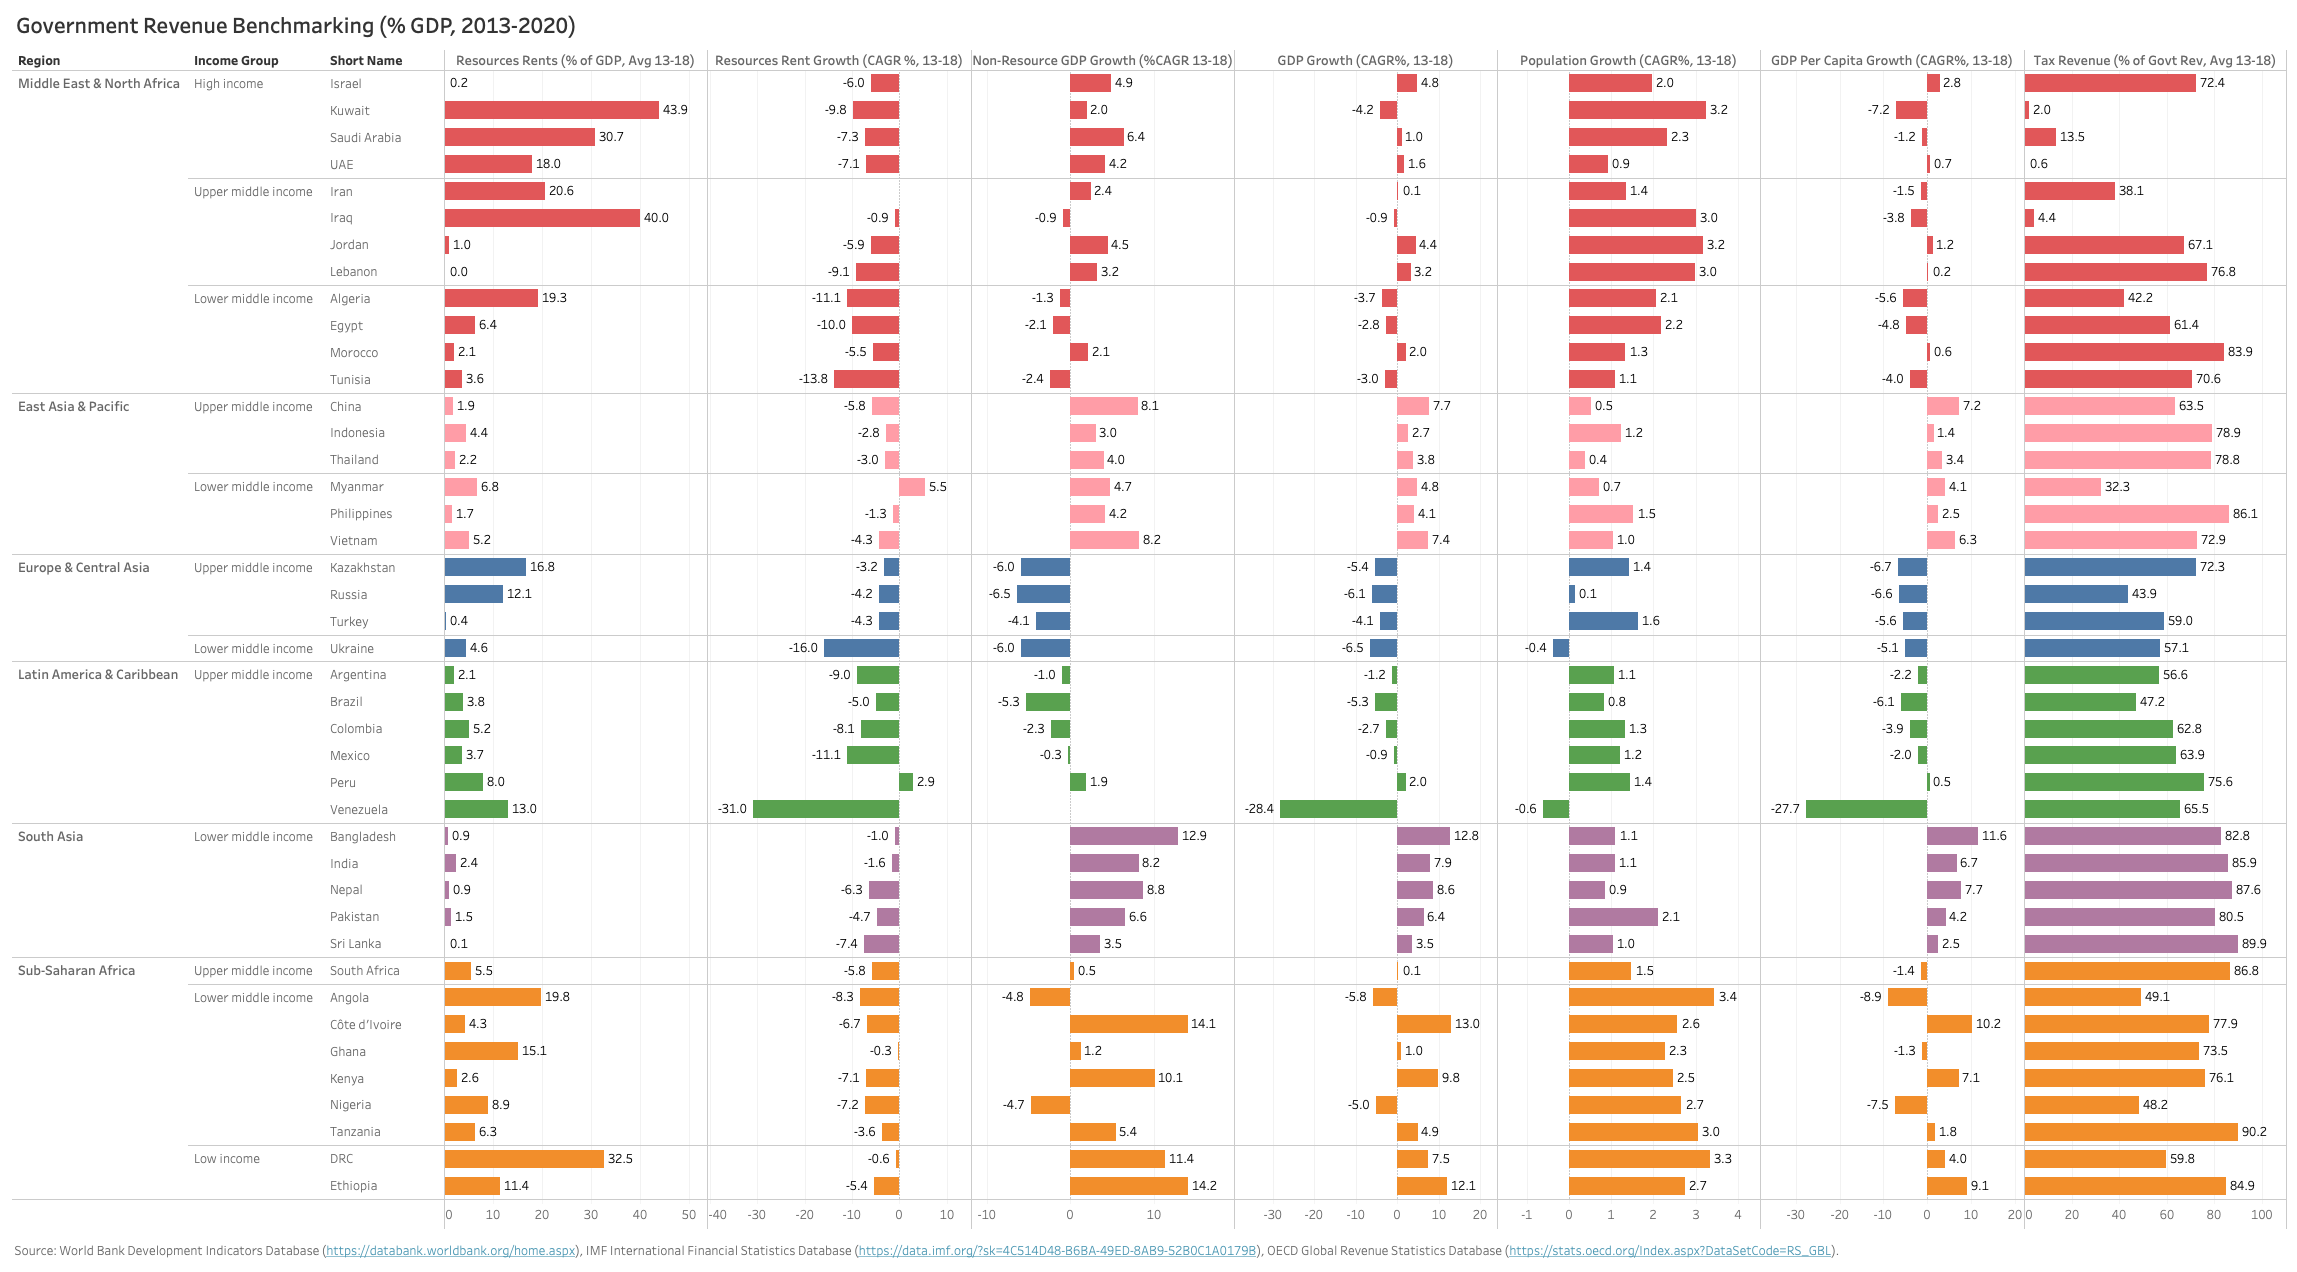
The high volatility of growth and the lack of diversification away from resources has in turn made the fiscal side much more dependent on fluctuating commodity prices for any resource-intensive country. General government budgets therefore are hostage to the commodity cycle (see Chart 19 below). As a result, essential government spending on social services also shrinks as deficit pressure mounts to curtail spending in a cyclical manner. Those countries that are more diversified are also able to fund counter-cyclical spending on social services via a broader tax revenue base. In this respect, Iraq is a major negative outlier since both tax revenues as a component of government revenue is so small and the external savings stock is very low.
According to the IMF, Iraq’s tax revenue to GDP has averaged a paltry 1.4% (one of the lowest levels globally and in the same neighborhood albeit even lower than GCC states like Saudi and the UAE), while government revenues as a percent of GDP stood at 31% during this period, suggesting tax revenues as a share of total fiscal revenues averaged only 4.4%. This is corroborated by a structurally low level of non-oil government revenues to non-oil GDP which the IMF reports to be only 5.35% in 2019. This low level of non-oil government revenues has remained structurally low, rising from 2% in 2004 to 6.8% in 2017. Emerging market peer countries (across the spectrum of resource-intensive or diversified) have much larger tax revenue bases relative to their fiscal budgets (ranging from 32% in Myanmar to well above 80% for most of South Asia). Even the likes of Russia, Nigeria, Algeria and Iran are in the 40% neighborhood. Such a low tax base and low non-oil revenue base are suggestive of just how incredibly small the formal non-oil private sector really is in Iraq.
Chart 19: Government Revenue Benchmarking (2013-2020)
Iraq shares this extremely narrow tax base with only a handful of resource-rich peer countries, which are commonly referred to as rentier states (see Charts 20 & 21 below). Both charts look at resource intensity levels relative to each of the revenue metrics separately (government revenue and tax revenue). We chose this extra step to tease out Nigeria’s positioning, since even though tax/revenue is 48%, the relative share of overall revenue is very low vs. GDP (8.5% government revenue/GDP, 4% tax revenue/GDP). Apart from Nigeria, it is not at all surprising that the rest of the small club of countries that occupy this quadrant are rich GCC hydrocarbon exporters – all of which are Iraq’s neighbors in the Gulf region and most also join Iraq as longstanding members of the OPEC cartel, leading oil exporters and reserve owners.
Chart 20: Resource Rents & Tax Revenues (% GDP)
Chart 21: Government Revenues & Tax Revenues (% GDP)
The ‘Unsocial Contract’
This small club of rentier economies also share a common social contract between governments and their citizens. They are predominantly autocratic governments that are not elected and therefore provide little in terms of ‘representation’. The GCC governments monopolize the resources of the state as well as how the rents from these resources are allocated and distributed, doling out social services as they deem fit, with little accountability, if any. As a result, the implicit agreement with their citizens is one where direct taxation is minimized or largely absent. As some of these rich countries start to diversify away from fossil fuels, this social contact starts to get challenged, particularly if the overall source of hydrocarbon revenue shrinks and the need for tax revenues rises as a result.
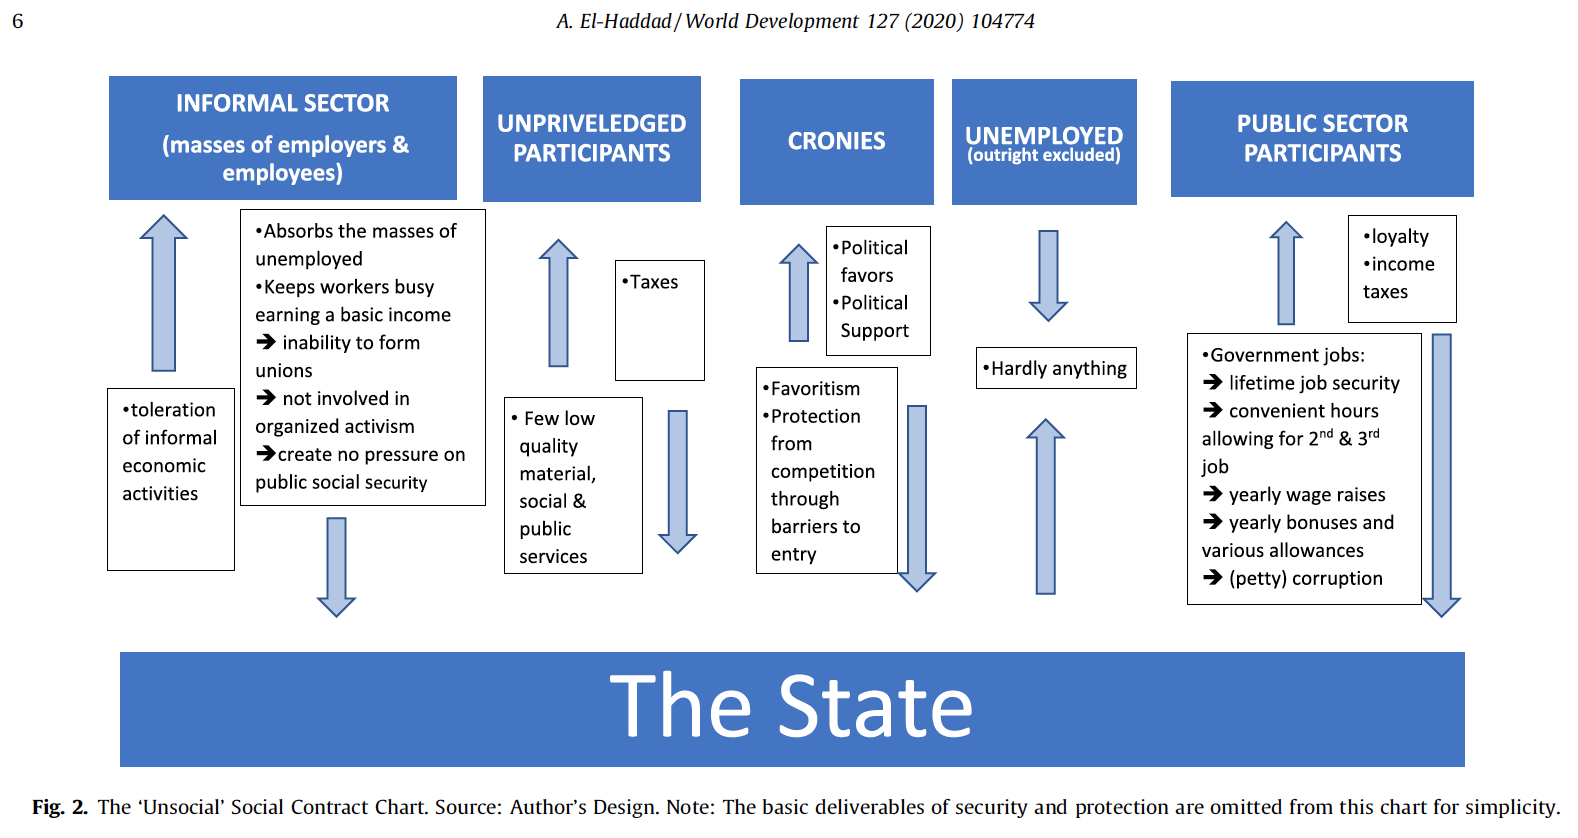
This ‘unsocial contract’ (see Chart 22 below from A. El-Haddad) manifests itself in Iraq in several ways: a) the public sector becomes the de-facto channel for ‘representation’ of Iraq’s oil wealth (that is for those with ample wasta or connections to actually get a government/militia job), b) oil-rents, which finance most public spending are vulnerable to volatile swings in oil prices, corruption/‘leakages’ (at worst) or inefficient public spending precisely because of weak institutions and lack of accountability, and c) government services are poor overall and extend only to a small portion of Iraqis that manage to benefit from this exclusive channel.
Chart 22: The ‘Unsocial Contract’
For the majority of countries globally, as the tax base rises, health and education expenditures also rise. Iraq joins several other rentier states, where an exclusionary system of ‘representation’ and a broken social contract hugely distort this relationship. A major dividend from diversification of the economy will be the gradual de-linking of state funding for social services from volatile oil revenues and a shrinking of the public sector in favor of a larger private sector that will help grow the tax base, with dividends to all Iraqi citizens in the form of better basic services.
Although Iraq currently shares some economic similarities to the aforementioned GCC states (in terms of resource-rent dependency, rentier development model, a broken social contract), the differences far outnumber these similarities and are of great interest to us at this particular juncture.
Iraq’s oil wealth, while significant in terms of reserve life and production potential (Iraq has the world’s 4thlargest reserves of oil, while boasting the highest reserve/production ratio of 83 years vs. top producers – see Charts A11-A12 in the Appendix) it cannot on its own sustainably generate a high living standard for its population. Like Nigeria, Russia, Iran and other large population countries that rely on oil as a major source of government revenue, Iraq is essentially forced to diversify in order to deliver a minimum acceptable standard of living for its citizens. This is particularly the case now with the developed world’s determined focus to wean itself off of fossil fuels in the next two decades in favor of renewable sources of energy. In an environment of structurally low oil prices, diversification becomes a necessity, not just an aspirational policy objective or the subject of an expensive McKinsey report.
Secondly, because of Iraq’s long history of decades of expensive war adventurism and the hundreds of billions of dollars in lost treasure lost, unlike most GCC countries and Russia, Iraq does not have a cushion of a large sovereign wealth fund or foreign reserves to fall back on. Like Nigeria, Iraq’s propensity and ability to save or borrow is low, due not only to the sheer size of the country’s population and the large state apparatus that is necessary to support it, but also due to the fact that the country’s infrastructure capacity is extremely weak and under-developed. Therefore, the anchor for both diversification and productive investment is dramatically stronger than for most middle- or high-income rentier states (this is a critical difference).
Third, Iraq’s hydrocarbon sector boasts a much higher share of investment/involvement from international oil companies (IOCs) than most (Nigeria is similar in this regard) which in turn have demanded a higher level of transparency and accountability in the oil & gas sector. As an example, this meant that in order to attract IOC investment early in Iraq’s production recovery phase, it needed to sign up to the EITI (Extractive Industries Transparency Initiative) charter. This not only has helped to attract foreign capital and know-how to the oil sector, it has also aligned Iraq’s oil revenue interests with those of the IOCs. This in turn gears Iraq’s resource exploitation model more towards that of a revenue-maximizer vs. a price- or market share-maximizer (as most GCC-OPEC members arguably are adopters of the latter two), thereby elevating the present value of oil revenues over the future value of reserves left in the ground and subject to the risk of becoming stranded assets. This once again calls into question Iraq’s membership in OPEC and its willingness to support prolonged production cutbacks, particularly since Iraq’s historical reserve exploitation has also been dramatically lower than the GCC or Iran because of its long history of instability.
Fourth, despite the dysfunctional and exclusionary manner which characterized the post-2003 Iraqi governance track record, the country has managed to build several strong and resilient state institutions, amongst them: a pluralistic electoral process, a trained and hardened federal military force, a functioning and independent central bank (since 2004 and reinforced in 2015) and the well managed quasi-independent state oil companies. Don’t get us wrong, there is obviously much more institution-building and strengthening that is needed. However, the checks and balances that are implicit in any inclusive sectarian governance model (if successful under a Khadhimi coalition or future governments) may in fact provide a much stronger and more resilient anchor for governance and reform vs. an autocratic ‘1-man’ (or ‘1-prince’) model.
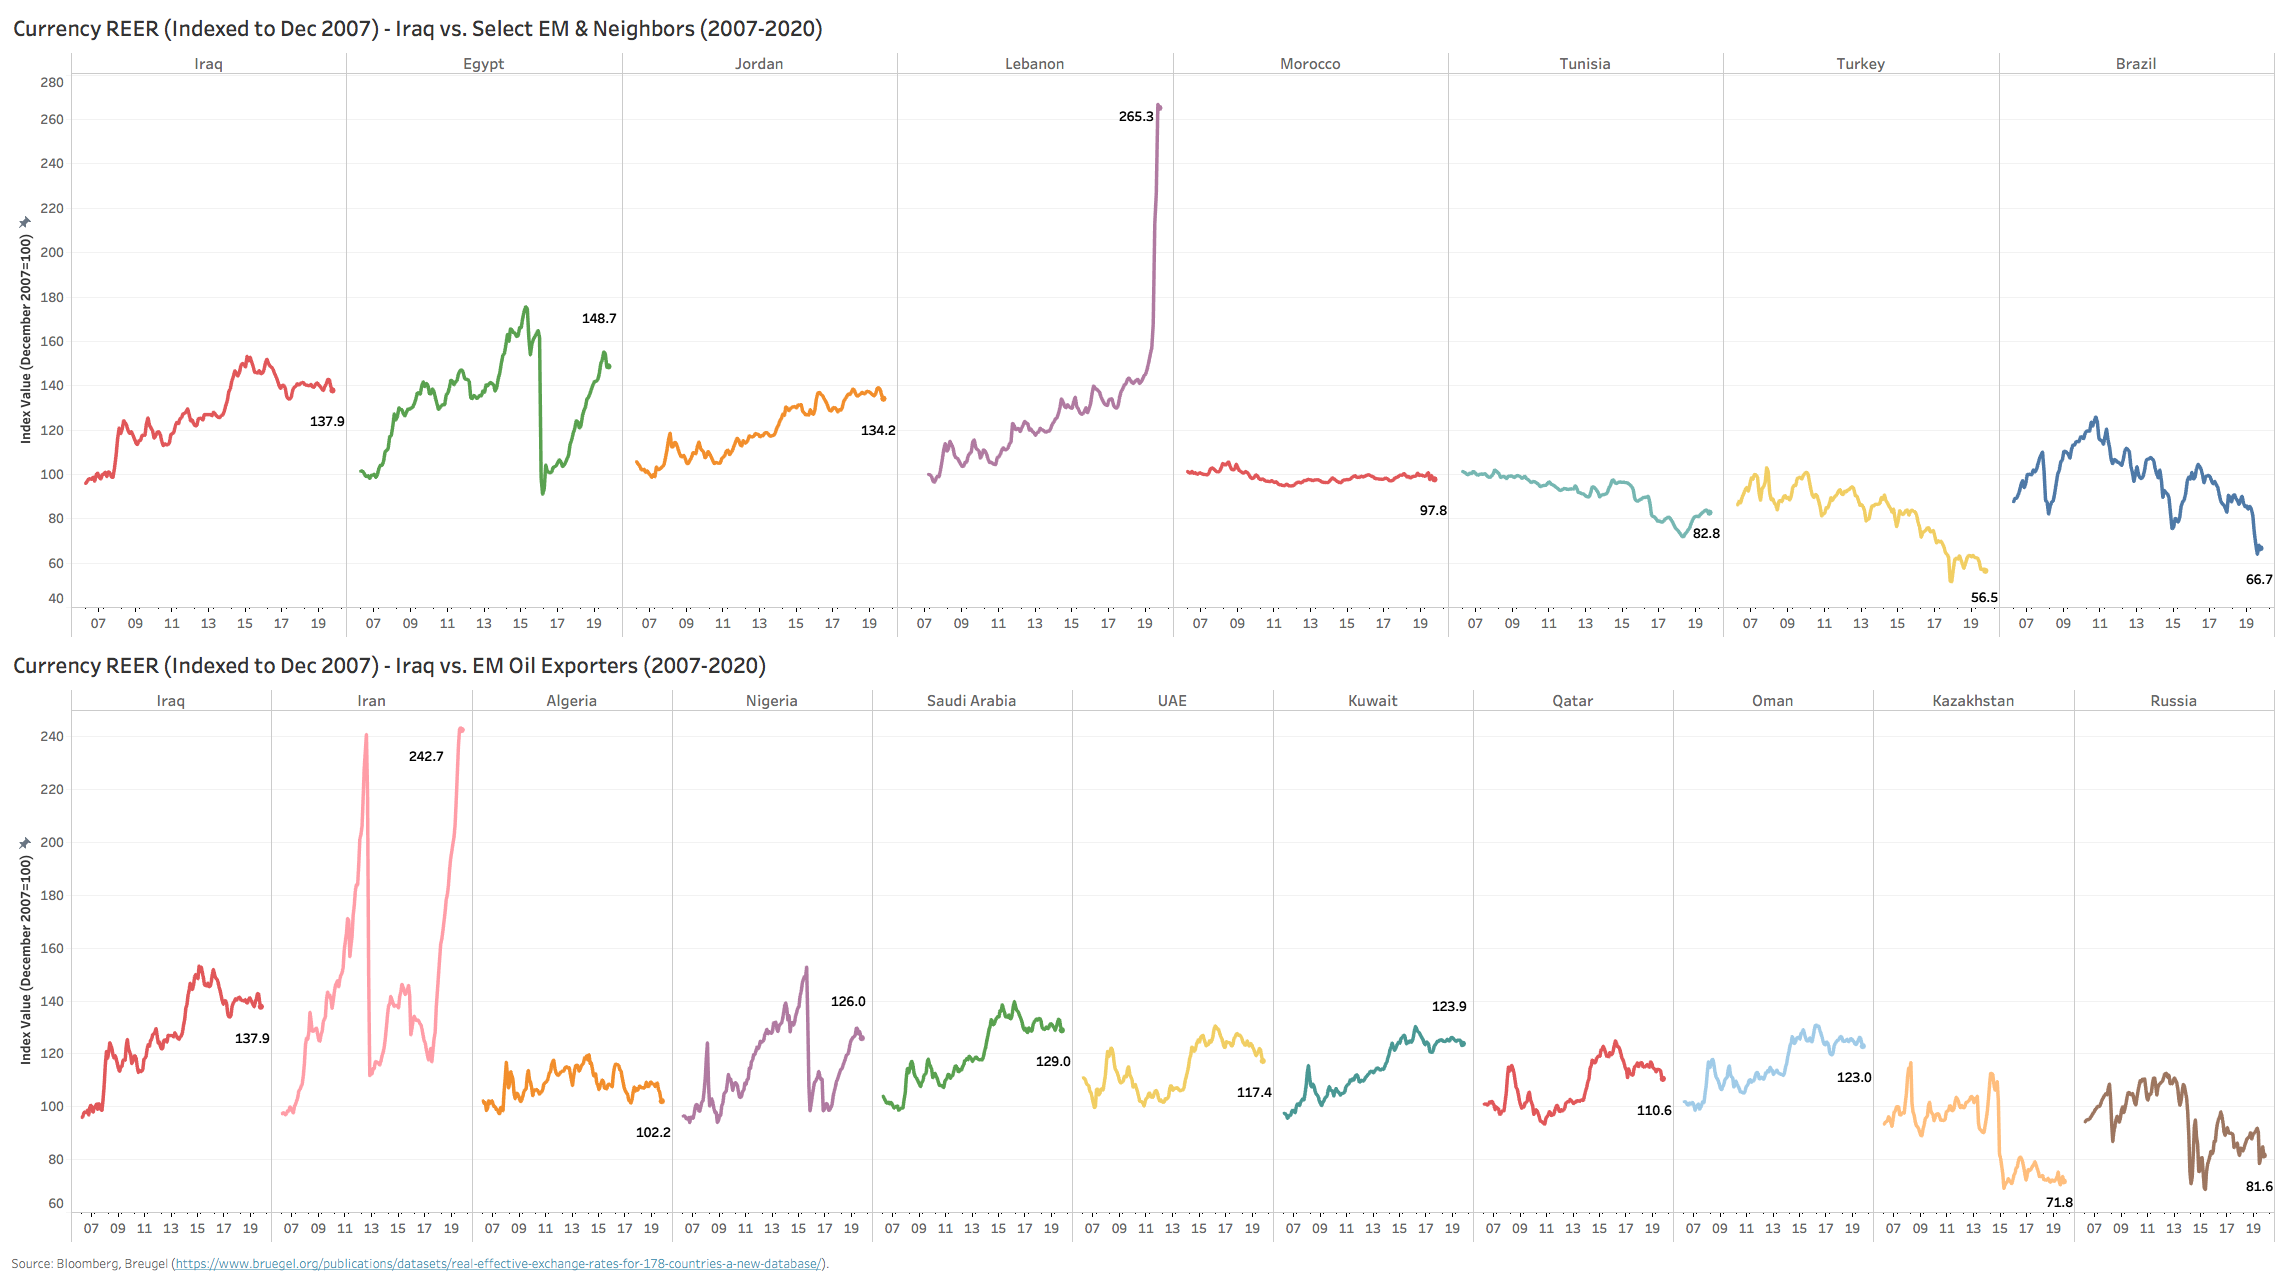
Fifth, unlike the GCC, we do not believe that the Iraqis necessarily view the US$ peg as sacrosanct. Unlike the longstanding GCC-US$-pegs, the Iraqi dinar was devalued substantially in the aftermath of the 2003 invasion but was re-pegged to the US dollar to arrest and contain very high inflation utilizing a dogmatic and narrow interpretation of monetary policy. Once Iraqi reserves are built back up to sufficient import coverage levels, the state banking system is restructured and liberalized and full capital account liberalization is complete, we see no reason why the IQD-US$ peg should be maintained. With the so called “dollar auction” system coming under intense scrutiny because of money laundering allegations, a planned privatization of Trade Bank of Iraq and with a more accelerated military disengagement by the US from Iraq, we expect the rationale for maintaining the peg to begin to weaken. A more competitive exchange rate for the dinar is much more aligned with both a revenue-maximizing oil export objective as well as a diversification-led development model. Having said this, and due to very low inflation of the past 5 years, the Iraqi dinar’s fair value does not seem to be highly dislocated relative to regional trading partners or other US$-pegged oil exporters (when viewed through a REER prism – see Chart A13 in the Appendix).
Finally, Iraq, and for that matter Nigeria, are not only much larger in population size, but both have chosen to adopt representative political systems of governance that at least in principle require accountability to their citizens. And yet, both countries have progressively acted more and more like rentier systems of late as demonstrated by their ever-shrinking tax revenue bases and rising resource intensity levels. As a result, their informal economies have ballooned, important social services like education and healthcare have deteriorated, crony capitalism has metastasized, and the public sector labor force has expanded to cushion the blow on unemployment. Sudden exogenous shocks to oil prices that are not cushioned by higher production have had a material impact on these countries’ ability to fund important social spending for their large, young and growing populations. Their ‘unsocial’ contracts have proven therefore to be much more vulnerable relative to their rich-resource peers.
Human Development
Most human development indicators for Iraq began to improve gradually during the post-2003 period according to the UN-HDR, with life expectancy gaining almost two full years to 70.5 from 68.3 and average years of schooling increasing from 5 to 7.3. Government spending on education and health was the main driver for this improvement as spending intensity ratios rebounded back to levels last seen only in the 1990s. This was obviously bolstered by a very strong oil revenue backdrop and occurred despite chronic budget under-execution (and leakages) by successive Iraqi governments for both capital budgets and recurrent operating budgets (some years were as low as 50% for the capital budget side per the World Bank).
Health and education spending (as a % of GDP) both rose to the 3%-4% levels by 2009 while per capita spending on both categories also snapped back but remained meaningfully below MENA and middle income averages (see Charts 23-26 below with expenditure trends for Iraq as well as benchmarking with emerging market peers). They were however well on their way to converging with the likes of Algeria and Kazakhstan on a per capita basis while even eclipsing many Arab peers like Morocco and Tunisia in health spending. In the case of education per capita, spending levels snapped back to above 1989 levels of $166/person, while health spending/capita grew from $53 in 2004 and eclipsed $150 by 2010, rising to over $200 by 2013. This sharp improvement occurred despite higher population growth during this past decade.
Chart 23: Iraq Fiscal Spending on Human Development vs. Military (1960-2018)
Chart 24: Fiscal Spending on Human Development vs. Military (% of GDP, 2013-2018)
Chart 25: Fiscal Spending on Human Development vs. Military (Per Capita, 2013-2018)
Chart 26: Iraq Government Spending by Ministry (2007-2015)
The 2015 oil price shock however derailed much of this momentum, with a sharp decline in rents per person, almost halving from $3,117 to $1,748 while military spending per person rose by over a third that year (from 3% to 5.3% of GDP and the highest level since 2003), mainly to shore up Iraq’s security forces in the aftermath of the ISIS insurgency that began the prior year. This in turn squeezed out spending on essential social services causing education expenditures to decline to below 1% by 2018 while preliminary budget reports indicated that health spending in 2018-2019 more than halved to below 2% of GDP. Even though Iraq spends only a fraction of what its GCC neighbors spend on arms (3%-4% of GDP vs. over 10% for Saudi or 6% for the UAE), the highly fixed nature of Iraq’s fiscal expenses (e.g. public sector wages which account for up to 50% of most year’s budgets) and its tiny tax base (averaged 1.4% of GDP in 13-18) in turn crowded out any spending on social services outside of the public sector. The dual shocks of the ISIS insurgency and the oil price drop brought Iraq’s ‘unsocial contract’ to a breaking point.
For Iraq, this acute neglect of the private sector and the proper infrastructure that enables it, has translated into yet another chapter of massive expansion of the oil-revenue-fueled state apparatus and yet another step taken away from diversification. This in turn created huge negative externalities, including: a) underinvestment in anything non-resource oriented, including Iraq’s security, basic infrastructure and social safety system, b) massive expansion in the public sector wage bill, c) the ballooning of the crony capitalist class that feeds off political favoritism while escaping competition, d) a further expansion of the informal sector which absorbs spillover job seekers and in turn perpetuates Iraq’s low tax revenue base and e) reinforcement of the poor environment for private investment (both domestic and foreign).
Let’s take several of these externalities that in our opinion represent key hurdles for sustainable reform and which themselves embody the core issues plaguing Iraq to illustrate their effects with some empirical data.
Underinvestment
In the area of underinvestment, despite the billions of dollars spent on reconstruction by the US-led coalition and the Iraqi government in the years following the US-invasion (see Chart 27 below with a summary of 2003-2012 from the US Congressional Special Inspector General for Iraq Reconstruction or SIGIR in 2013) there is very little to show for it in terms of non-oil productivity or infrastructure.
According to SIGIR, the US alone spent over $60 billion during this short period, with another $14 billion spent by the international community. On top of this, the Iraqi funding itself totaled close to $146 billion, with the majority coming from government budgets during this period (2003-12). Relative to the size of Iraq’s recovering economy, this deployment of capital was gargantuan (a total of $220 billion in outlays vs. a starting point GDP of $37 billion in 2004). Where did all this money end up and why has the impact thus far been muted?
Chart 27: US Special Inspector General for Iraq Reconstruction (SIGIR) – Cumulative Spending (2003-2012)
The answer to this important question still evades us, despite decades-long donor-led forensic audits and investigations. The obvious conclusion is that a big portion of the money was ‘leaked’ to contractors and intermediaries, whether Iraqi or foreign. What is amply clear however is that there remains scant evidence that most of this capital was in fact deployed legitimately and productively. Even post 2012 in the ensuing years to date, assuming a similar run-rate of Iraqi government spending on reconstruction, this would imply total spending of approximately $250 billion on internal security, reconstruction and rehabilitation. So then why do most Iraqi cities still face chronic power shortages and deficits in everything from gasoline refining capacity to basic social services like garbage collection and water treatment?
The chronic power sector deficit is a loud case in point and the reform challenge here is a really useful microcosm through which to view Iraq’s broader reform track record. Despite substantial investments in this sector since 2003 (almost $45 billion has been spent to 2015), most Iraqi cities still experience daily power cuts and rolling blackouts (some cities only get 9-12 hours of uninterrupted power; 15-hour blackouts on average), which have persistently inflamed public anger. While the generation side has had big capacity additions since 2003 (more than doubling to above 82 bkWh according to the EIA; Chart 28 below) almost two-thirds of this capacity is lost due to poor transmission and distribution networks, the highest loss percentage of any peer country in the developing world inclusive of Venezuela (see Chart 29 below with benchmarking).
The 1990-91 war and the ISIS insurgency in 2014-17 took their toll on the national electricity grid, degrading or making almost one-fifth of the grid inoperable. Reports from the Iraq Energy Institute also indicate that less than a third of electricity supplied is ultimately paid for by customers (despite costing less than 1 US cent/kWh vs. an estimated cost to the government of 10 cents/kWh) exacerbating the commercial side of maintaining the grid and upgrading the network. According to the IMF, in 2018 these power sector subsidies alone accounted for almost 10% of total government expenditures (yet another stubborn fixed cost). To plug the large and growing power deficit (23.6 bkWh in 2017 and representing 44% of overall demand) Iraq has been forced to import expensive electricity from Iran and Turkey (11.8 bkWh or 22% of demand). In the meantime, Iraq is one of only a handful of countries still flaring associated gas (16 bcm was flared in 2018; Iraq is endowed with the world’s 12th largest gas reserves but 70% of it is associated gas). The lack of investment in gas pipelines prevents Iraq from monetizing this asset at the wellhead instead of flaring it, which if done could save over $5 billion annually by making imports redundant (according to a recent report from Georgetown University). Both the IEA and World Bank expect Iraq’s electricity demand to double by 2030 (Chart 30 below), just tracking demographic growth and a normalized consumption intensity, entailing over $90 billion in investments.
Reform in this area is of obviously critical. Not only is access to power a basic prerequisite for a minimum level of human productivity and living standards, it is the primary enabler of industrialization and commercial activity. Despite its elevated importance, reforms here seem to have hit roadblocks that are all too familiar – a bloated and rigid SOE sector which includes most of the generation entities and the national grid, poor investment execution of past budgets (both ‘leakages’ and bureaucracy) and a reluctance to privatize or deregulate, thereby avoiding to embrace a market-based tariff framework which would reduce commercial losses and incentivize more efficient consumption.
Reforms & Corruption
While the broader reform report card for Iraq is a subject of intense scrutiny and analysis, it is important to step back and look at the attribution for reform performance and the trends underlying these attributes.
Lets tackle corruption first. Talk to anyone about corruption in Iraq, and you will likely get a mouthful of anecdotes, data and statistics that support Iraq’s extremely poor ranking globally in terms of its corruption perception index (‘CPI’) score (Chart 31 below with data from Transparency International). In fact, Iraq’s ranking has deteriorated markedly since 2003, falling from 113th ranked to 162nd by 2019. But this poor ranking masks the improvement in Iraq’s score which bottomed in 2008 and has slowly improved since then. Despite this, Iraq’s score remains in the bottom decile of countries worldwide, while ranking third worst within MENA and ahead of only Libya, Yemen and Syria.
Endemic corruption obviously remains a chronic and important impediment for any kind of reform or sustainable growth, but we believe that corruption is more of a symptom of poor and non-inclusive governance and weak institutions than it is the cause.
A recent superbly written NYT article ‘Inside the Iraqi Kleptocracy’, paints a detailed and very vivid expose’ of corruption in Iraq, tracing many of these symptoms back to what the author deems to be their root origin – primarily US complicity via political interference. The examples he gives are too numerous to list. Here are a few in summary: 1) US complicity in clearing Iraqi oil sales via the Federal Reserve, while reinforcing strict financial sanctions against Iran & Syria – effectively incentivizing illicit flows and money laundering through the Iraqi banking system, 2) US complicity in supporting oligarchic tendencies, crony capitalists & powerful militias tied to ruling governments that are now shaking down entire provincial governments, 3) the ‘ghost soldier’ kickback schemes in the military which laid the ground for an embarrassing retreat by an under-resourced army when ISIS emerged on the scene in parts of the country, 4) the ‘unwritten’ manner in which ministry appointments are made to purely sectarian-factional interests (again with direct US complicity) and 5) how the US-designed and supported FX auction system was effectively set up and used to promote fraudulent transactions just to benefit a small group of arbitraging middle-men. Robert Worth, the article’s author, describes the corruption brought about by the FX auctions as follows:
“It is impossible to say exactly how many billions have been stolen through exchange-rate arbitrage, but several former bankers and Iraqi officials told me that this kind of fraud accounts for most of the ostensible imports financed by the dollar auction since around 2008. My own estimate, based on figures from the central bank’s website and information from Iraqi bankers and finance officials, is about $20 billion, all of it stolen from the Iraqi people. The businessmen running the scheme are virtually printing their own money, because their costs — paying for fake invoices and bribing bank and government officials — are low. Some of the banks posting enormous profits from the auction are little more than fronts, with dilapidated branch offices and scarcely any employees. One bank bought $4 billion in dollars on the auction, I was told by a member of Parliament who has investigated corruption cases, a total that would correspond to a profit of $200 million. “We checked on this bank,” the lawmaker said. “It has one room, one computer and some guards.”
“The damage caused by the auction fraud was not just about illicit profits. As Iraq’s commercial banks transformed into instruments for arbitrage, ordinary businesses were left without access to the loans they needed to grow. Some legitimate importers, unable to get dollars from the auction, were forced to use foreign banks instead. It is hard to know how much harm this did to the economy, but all the analysts I spoke to said it has been devastating, starving the country’s private sector and making Iraq even more dependent on its oil proceeds, which have been cut in half in recent months.”
It’s a fantastic article and one that is a must read for anyone that is concerned about Iraq’s future. However, the article while thorough in identifying all the varied forms and channels of modern-day corruption in the country’s ‘self-sustaining system’ of kleptocracy, it comes up short on diagnosis and possible remedies. Having covered early stage developing countries for decades, we must admit that Iraq doesn’t seem to be materially different than most developing countries that face endemic corruption in their societies (definitely the majority of developing nations in our opinion). The biggest difference between Iraq and say Bangladesh, India or Colombia are: a) the alignment of interests and a sense of inclusion between the country’s various stakeholders, b) the strength of the state’s institutions (not just the judiciary, but also legislature, education system, police, the central bank and others), and c) the sanctity and enforcement of the rule of law. Iraq has built the foundations for all of these key pillars; they just need to be reinforced and strengthened by an empowered and courageous leadership. We strongly disagree with the author’s suggestion that only an autocratic strong man like Singapore’s Lee Kwan Yew can be an effective antidote for such a disease, no matter how entrenched or spread out it has become.
On the remedy side of things, it is also important to acknowledge that for many of the laundry list of symptoms of corruption, there are as many effective and pragmatic reform and regulatory options that are by no means exclusively available to autocrats or strongmen. Take for example the corrupt and misguided auction system described above. An effective regulator at the CBI and a full liberalization of the banking system would provide a level playing field and introduce intense competition for FX dealing which would in turn eliminate the artificial arbitrage spreads for sham outfits. Iraq is not the first country, nor will it be the last, to deal head on with both an entrenched culture and symptoms of corruption. Success is not a binary function nor can it happen overnight. Leadership that understands this and is willing to undertake these remedies incrementally is what has been missing so far.
Chart 31: Corruption Perception Index Score Trends – MENA (2003-2019)
Back to overall reforms. In attempting an appraisal of Iraq’s reform track record, what we find much more useful are the individual attributes of governance quality that in turn drive reforms. The World Bank compiles its own governance indicators and tracks them annually (see Chart 32 below comparing Iraq to Egypt and the UAE on six distinct indicators from 1996-2018). Iraq’s relative trends are notable in that attributes like government effectiveness and regulatory quality – both showed consistent improvements since 2003 and up until the 2009/10 period when they began to stagnate or decline. This period coincided with the 2010 election fiasco, no doubt. By 2014, the like of CSIS and other think tanks were describing the ‘Maliki scorecard in Iraq’ as “hitting bottom” when Iraq’s scores on most WB attributes took a major step down. Since 2014, one could argue that apart from ‘voice & accountability’, all the other attributes of governance are now either meaningfully lower or at the same level as they were in 2014.
While the political stability and rule of law scores generally reflect Iraq’s war and the ISIS insurgency event timeline, the ‘control of corruption’ score trend reflects the same stagnancy of the CPI. The big outlier for Iraq however is ‘voice & accountability’ which shows a consistently improving trend for Iraq since 2003 and one that now uniquely scores Iraq higher than either the UAE or Egypt (in all the other 5 attributes, Iraq remains a big laggard and is one of the worst-ranked globally). Relative outperformance here is however quite telling and underpins the fact that Iraq is far less able to suppress its animated populace. The October 2019 uprisings were loud proof of this.
So, where does all this leave Iraq in terms of either foreign or domestic investment appetite? Iraq’s Ease of Doing Business (EODB) ranking has very much tracked its governance performance, with a 2005 ranking of 150/155 improving only slightly to 172/190 by 2020 – keeping the country in the bottom decile worldwide (see Chart 33 below). On the positive side, starting a business has gradually improved since 2012, so has dealing with construction permits. Despite this, on both counts Iraq still scores quite poorly relative to regional peers. In the case of enforcing contracts, resolving insolvency, trading across borders and (especially) access to credit – Iraq has consistently scored very poorly and has shown very little improvement since 2005. This has translated into virtually no non-energy related FDI since 2004, and in fact a net cumulative outflow from the balance of payments of close to -$27 billion during this 15 year period where Iraq’s net FDI to GDP ratio averaged -0.6%, matched in dead last place globally with the likes of Angola and South Sudan. Outflows during the ISIS insurgency years (2014-17) amounted to 15% of annual GDP and wiped out 1.5x of total net FDI inflows into the BoP from 2003-2013. On the portfolio side, it has also been a one-way flow outward, with World Bank data suggesting a cumulative outflow of -$4.7 billion during this period as well.
Chart 33: Iraq – Ease of Doing Business Trends (2005-2020)
Finally, while Iraq hasn’t been a very hospitable place for foreign private sector investors, it has earned the accolade as one of the biggest cumulative recipients of development and military aid. The country ranks third after India and Egypt in terms of net official development aid with cumulative receipts (1960-2017) of $78 billion while it ranks fifth in terms of cumulative US bilateral aid (1960-2018) at $83 billion (53% development related, 47% security/military related) – see Chart 34 & 35 below. With the US military disengagement from Iraq almost complete (as of 2020, only 3,000-5,000 US troops remain), the country will need to fend for itself, especially on the security front. This implies that Iraq’s current military budget (2019 of 2.7% of GDP) will need to rise substantially in years to come.
Chart 34: Net Official Development Aid (1960-2017)
Chart 35: US Bilateral Aid (1960-2018)
Labor Market
The other big negative externality is the imbalance created in the labor market which has manifested itself in a bloated public sector work force and a ballooning government wage bill. Every year roughly 600,000 Iraqis seek to join the job market, with barely 150,000 job opportunities created annually (2007-2012). With the oil & gas sector only employing ~1% of Iraq’s labor force and with low output-elasticity of employment in the oil & gas sector (-0.2), the huge oil revenue growth has not translated into new jobs. With private sector job creation remaining quite stagnant since 2003, a disproportionate share of new jobs (as much as 4 out of 5) have been directed to the public sector in recent years.
According to the World Bank, public sector employment rose from 900,000 in 2003 to 2.4 million in 2008 and reached over 3 million by 2015 (see Chart 36 below). As a share of total national employment, public sector jobs rose from 22% in 2003 to over 42% by 2015. If one looks at the ratio of public sector employment to the official labor force, the ratio leaps to 55% (data as of 2012) – ranking Iraq fourth highest amongst developing countries (Chart 37, top panel).
Chart 36: Iraq’s Core Public Sector Employment (2003-2015)
Chart 37: Iraq’s Public Sector Employment & Wage Bill in a Global Context (2016/17/19)
This growing imbalance has been perpetuated by the wage differential between public & private jobs, with the former offering greater benefits, less hours and almost a 30% wage rate premium. This in turn crowds out the private sector from accessing affordable labor but has also led to lower overall labor force participation rates, as job seekers without any preferential access to the public sector are driven to the informal economy while emigration is almost impossible. As a result, higher structural unemployment ensues, which is why official unemployment rates (which are grossly understated) have risen from 8%-9% for most of the last decade to almost 13% by 2020 and continue to rise. This trend is even more acute in the youth segment of the population, with official youth unemployment (ages 15-24) reaching over 25% in 2020 from 17% in 2003 (Chart 38, middle panel).
Chart 38: Iraq’s Unemployment Profile in a Global Context (2019)
The impact on Iraqi women is worth highlighting here as female labor participation rates have dropped to a dismal 5% from almost 9% in 2016 and now rank second-to-last worldwide (Chart 38 above, bottom panel and Chart 39 below). This is corroborated by female unemployment rates that are double their male cohorts (27% vs. 14% for all ages; see Chart 40 below from the World Bank) and female youth unemployment rates that are now 65% vs. 32% for young males. With Iraq’s labor force highly educated (65% with advanced education) but unable to find suitable jobs and with youth population expected to grow by 72% (between 2015 and 2030), the picture starts to look like a ticking demographic time bomb.
Chart 39: Female Labor Participation Rates vs. GDP Per Capita (2019)
Chart 40: Leading Markers of the Jobs Crisis in Iraq (World Bank)
With the total official stock of unemployed now standing at over 1.4 million, the World Bank expects this level to rise to at least 2.5 million by 2030 as the labor force grows by over 50%, fueled by the generational youth bulge that is playing out currently. Their calculus suggests a need for at least 5-7 million new jobs by 2030, just to satisfy the growth in the labor force and keep unemployment rates stable. It is clear to us that if the private sector continues to be crowded out from the labor market, it cannot supply ample job opportunities to important non-oil sectors, further delaying the drive to diversify the economy away from hydrocarbons.
Inequality, Informality & Iraq’s Shadow Economy
In the meantime, and as a direct consequence of high unemployment and a lack of jobs in the formal private sector, more and more Iraqis are being driven into the informal labor market and Iraq’s shadow economy. Data from the ILO and World Bank suggest that Iraq’s shadow economy may already be as large as 20% of the official GDP (as of 2017) with informal employment as high as 55% of the formal labor force (and as high as 67% of the non-agricultural labor force; Chart 41). With public sector employees making up a third of the official labor force, this would suggest that informality levels in the private, non-agriculture side are at least 33% and expected to grow significantly over the coming years. A study commissioned by the Ford Foundation in 2015 (which drew on ILO enterprise classification data) estimated that informality rates outside of the public and agricultural sectors were as high as 85% in Iraq in 2012 (in total), and as high as 95% for Iraqi women (Chart 42 below).
Chart 41: Informal Employment & The Shadow Economy (2019)
Chart 42: Informal Employment in the Arab World (2012/2015)
The obvious point here with growing informality (which is a festering issue across the Arab World’s countries who share similar demographic and labor pressures) is that it creates a pretty vicious cycle: more new entrants to the workforce are informal, new enterprises that employ them are less inclined to pay taxes and the already tiny tax base remains small or shrinks further, thereby perpetuating the structural dependency on the state oil apparatus for funding and the public sector for absorbing job seekers. This in turn, according to most economists like Thomas Picketty, one of the founders of the World Inequality Database (WID) drives a bigger wedge between the ‘haves’ and the ‘have-nots’, deepening income and wealth inequality in the country. While Iraq’s historical inequality data per WID is scant, their estimates indicate that the top 1% of income earners control upwards of 22% of the total income and the bottom 50% claim only 15%. These are conservative estimates if you ask us, especially when one looks at this inequality profile relative to EM and regional peers (see Chart 43 below). Again, the profile similarities with other resource-dependent states and rentier states is noteworthy here.
Chart 43: Income Inequality – Income Share of the Top 1% vs. Bottom 50% (1980-2016)
Informality, rising inequality and the hollowing out of the private sector also end up impacting household consumption patterns, as we noted in Chart 2 above with the divergence of Iraqi headline GDP growth rates vs. per capita household consumption growth rates since 2003. If one looks at a snapshot of household consumption mix by segment for Iraq relative to a handful of middle-income EM peers (Egypt, Colombia, Russia & Nigeria) both the contrasts and similarities are quite telling (see Charts 44-46 below from the World Bank Consumption Database which are based on 2010 household consumption surveys).
Chart 44 shows consumption mix for each of the countries by consumption segment (high, middle, low and lowest). Even though the national mix profiles (‘All’ – top row) are quite similar in terms of broad consumption mix (the outlier being Nigeria which is the lone ‘lower middle income’ country in the sample with a disproportionately large ‘base of the pyramid’ at 90%), the profiles for the ‘Higher’ and ‘Middle’ segments are quite different.
Chart 44: Household Consumption Mix by Sector & Segment – Iraq vs. EM Peers (2010)
The ‘Higher’ income group in Iraq spends far less on more discretionary categories such as education, health, ICT and financial services than their counterparts in Colombia, Russia and even Egypt while sharing a more similar profile to high income consumers in Nigeria. This makes sense due to Iraq’s under-developed infrastructure (e.g. power, logistics, hospitals, schools). Even those in Iraq’s upper income categories (making up for 16% of the population and more in-line with Colombia’s income mix) that can afford these relative luxuries do not consume them because of supply constraints.
The ‘Low’ segment in Iraq’s consumer class, which is by far the largest (61% of the population, and once again much more in-line with Colombia in relative proportion) looks much more like those of Russia and Nigeria (high resource-intensity economies) than Egypt and Colombia (lower resource intensity economies) in terms of consumption mix. Furthermore, the ratio of per capita spending of the ‘Higher’ income segment vs. the ‘Low’ segment for Iraq largely mirrors that for Russia and Nigeria, but only in the discretionary categories. For the non-discretionary categories (e.g. food, housing, transport, and even clothing) Iraq’s implicit inequality of consumption shows greater similarities to Egypt & Colombia (Chart 46).
Iraq’s household consumption picture tells the tale of two worlds that are bifurcated and diverging from one another – those in the top and middle segments or the ‘haves’ (ostensibly the wealthiest 1% and the bulk of the public sector-employed middle class which make up the lion’s share of 16%) and the ‘rest’ – 80% of the population in the lower two classes. Iraq’s ‘rest’ consumes less than an eighth of the ‘haves’ in overall spending, while in some cases (e.g. ICT, financial services and education) the ‘rest’ spends as low as one-tenth of what their wealthier counterparts spend. In less than two decades post the US invasion in 2003 when per capita household income hit near ground zero, Iraq’s consumer profile has morphed into the worst of two consumer worlds- beneficiaries of a rentier system of hand-outs and a largely informal and neglected segment of consumers.
Chart 45: Household Consumption Per Capita by Segment – Iraq vs. EM Peers (2010)
Chart 46: Household Consumption Per Capita by Segment & Sector – Iraq vs. EM Peers (2010)
There are many more takeaways from the 2010 household consumption survey, but one observation that leaps out of the data is the incredibly lowlevel of spending on financial services – both across all Iraq’s consuming segments and especially vs. more developed middle-income countries like Russia and Colombia. Iraqi consumers overall spent less than 0.1% on financial services in 2010, lower than Russia (0.6%) and far lower than Colombia (7.3%), a country with a similar population size and per capita income. Even for the highest income class, Iraqis spent only 0.3% on financial services vs. 2% for Russia and 15% for Colombia (red pie slices in Chart 44 above). In terms of spending on financial services, Iraq’s profile more closely resembles that of Egypt and Nigeria, both countries with relatively developed banking systems, but with a large ‘base of the pyramid’ that remains largely unbanked.
Banking Sector
According to a recent paper authored by Iraq’s newly appointed Finance Minister, Ali Allawi, Iraqi banking assets held abroad are estimated to be between $125 billion-$150 billion, and could be as high as $300 billion. Minister Allawi (an MIT educated civil engineer, graduate of Harvard Business School and a former fellow at Princeton before serving as Defense Minister in 2003-4 and Minister of Finance in 2005-6) claims that large chunks of these offshore assets, a portion of which may have been ‘illegitimately acquired’, now likely sit in regional banking systems and offshore havens with a geographic footprint that mirrors that of the Iraqi refugee diaspora (see Chart 4, bottom right map with the 2009 diaspora footprint).
Of timely relevance is Allawi’s assertion that as much as $20bil of these deposits may have been parked in the Lebanese banking system, with similar amounts having made their way to Jordan and Dubai. This would partially explain the artificially high deposit/GDP ratios for several of these destination banking centers, many of which host large and affluent Iraqi expatriates.
What is quite poetic about the case of Lebanon is that in the aftermath of the 2019-20 Lebanese banking crisis & sovereign default, these offshore Iraqi deposits are now frozen and most likely subject to a large haircut post any restructuring. The irony here is that these deposits would have been far safer if they had just stayed at home in Iraq, ostensibly used to finance productive investments and fund private credit growth. Apart from the short-lived ISIS-insurgency period (2014-17), Iraqi bank deposits have grown at a healthy & consistent clip, growing at roughly 30% CAGR since 2003/4, with a notable acceleration in the 2Q of 2020 after the Khadhimi-led government was formed (Chart 47 below which shows the monthly trend in deposits overlaid on top of the trend in Iraqi civilian deaths from 2003-2020).
Chart 47: Iraq – Deposits (Monthly Trend, Central Bank of Iraq) – 2003-2020
To appreciate the context and sheer size of the offshore Iraqi banking assets, it is useful to contrast it to what is currently onshore. The World Bank estimates that Iraq’s total onshore financial system deposits were roughly $50 billion in 2018 (22% of Iraq’s $225 billion GDP – Chart 48 below). While the deposit penetration rate has more than doubled since 2004, it remains at between half to as low as one-fifth the level of most peer country ratios. Private credit has had an even more pronounced post 2003 growth, more than quadrupling from the very low level of 2.6% in 2006 to 9% by 2017 (Chart 50 below).
If you take out an estimate for non-resident bank liabilities (~3% of GDP) and those associated with the large but insolvent state banks (~75%-80% share of total deposits), that leaves roughly $9-$10 billion in private bank deposits – just shy of 4% of GDP and a far cry from the 50%-100% ratios for most regional & oil exporting peers. So even at the lower end of the Finance Minister’s estimate range for offshore Iraqi deposits ($125bil) – this would translate into 3x the stock of onshore deposits and up to 33x that of private bank deposits.
It is important to keep in mind that the hyperinflationary period prior to the 2003 invasion effectively wiped out the private banking sector’s Iraqi Dinar balance sheet to nil by 2004 (inflation averaged 50% annualized between 1990-2006, only to decline to a 32% average between 2003-06). What largely remained were the foreign currency balance sheets of legacy state banks that were carried over with a questionable capitalization basis from the Saddam period. These banks were used primarily to perform quasi-fiscal operations during most of the late 1990s, so they accumulated a large book of non-performing loans to the state and foreign creditors. These assets were never restructured, and consequently, their share on the funding side (via their large legacy deposit base) was protected by the CBI. The CBI did so by restricting the newly set-up private banks from competing with state banks on both the deposit side as well as credit side (SOEs and government agencies were not allowed to deal directly with private banks). They even restricted private banks from any non-interest transactions with SOEs (e.g. LCs for imports, public sector payrolls, tax collection, etc.) which severely limited their ability to grow. Finally, only the state banks enjoyed an implicit government guarantee on deposits in order to protect their deposit franchises. The government went a step further in 2003/4 and set up the Trade Bank of Iraq (or ‘TBI’, essentially an SOE bank ring-fenced from the legacy state banks, wholly-owned by the Iraqi government and co-managed by JP Morgan with a consortium of foreign banks) to monopolize the trade finance side.
Private banks were essentially only allowed to trade FX via the CBI auction to earn fixed fees and were free to lend to the tiny private sector at very high (20%+) interest rates with ~9%-10% spreads or invest in CBI paper at 16%-20% (discount rates were 12%-14% at the time). Interest rates were anchored at a very high level during 2003-2006 in order to bring inflation down, de-dollarize the economy and stabilize the dinar (these remain the CBI’s top mandates to date; by 2007 the IQD/$ had appreciated by close to 17%). As a result of these policies, the zombie state banks remained dominant and protected fixtures of the Iraqi banking sector, and remain so to the present day, while the private banking sector (and thus the overall size of the banking system pie) began to stagnate by 2015 when state banks throttled back lending growth from unsustainably high levels (for example, state banks grew their loan books by 100% in 2010 vs. a system growth of 40%-50%, according to the World Bank).
Reform of the state banking sector has been on every Iraqi government’s top agenda since 2003 and is one of the top IMF reform recommendations in every Article IV report we have read since 2006. Despite this and formal endorsement from the CBI and Ministry of Finance, these reforms have been slow, while the full restructuring of the state banking system has yet to be pushed through despite several IMF initiatives since 2015.
In the meantime, TBI has managed to carve out a pretty lucrative niche that sits between the zombie legacy state banks and the severely corralled private banks in the form of a dominant 80%+ share of trade finance transactions. TBI boasts a capital size of $3 billion as of December 2019, a factor of 6.25x larger than the largest listed Iraqi private bank (Kurdistan International) and over 14x the average listed bank’s capitalization. Assets for TBI ($29 billion) grew by an impressive 68% in 2019 (according to Zawya) while asset growth for private banks overall barely grew by 6%. Once again, the chosen model adopted by government here is to provide an SOE like TBI a protected monopoly in financing the one channel of capital intermediation that is growing in the country while starving the private sector players. Like TBI’s counterparts in the SOE-owned oil production entities, TBI employs barely 90 employees – so any kind of potential job creation from growth is limited to a single captive public sector player.
There is very little debate about the necessity of a well-functioning and well-capitalized banking system, especially for post-conflict, transition countries like Iraq that need massive capital inflows to finance reconstruction and recovery post the ISIS years which ended in 2017. The World Bank in 2018 estimated that this need for capital is even more pronounced since Iraq was effectively closed off from foreign capital markets for almost two decades ahead of the 2003 US invasion. Despite widespread acknowledgement of how important access to finance and credit are to sustainable and inclusive growth, this key reform has yet to be accomplished. Once it is finally pushed through, we believe it will be a major catalyst for the banking system’s growth, the growth of the private sector as well as overall non-oil economic growth.
Chart 48: Financial System Deposits to GDP – Iraq vs. Neighbors & Oil States (2004-2018)
In terms of banking depth, Iraq is not only a big outlier in the regional and emerging middle-income context, it is also an outlier in a global context because of its sheer size. Iraq in 2019 was the world’s 29th largest developing economy in terms of GDP and 22nd largest in terms of population (Chart 49 below). Relative to this peer group of top 36 developing countries in 2017, it has the third lowest penetration rate in terms of banking assets/GDP (at 22%, it is only slightly higher than Argentina), the third lowest rate of deposits to GDP (also 22%) and by far the lowest rate of credit penetration which stood at 9%. The next three bottom-ranked countries by deposit and credit penetration (Argentina, Nigeria and Pakistan) have significantly higher overall penetration rates, but without the crowding out of the legacy state banks as a dominant phenomenon (on both sides of the balance sheet) like with Iraq. On a private deposit basis, Iraq’s 4% level is a far cry from even highly dysfunctional banking systems like Argentina or Nigeria that suffer from chronically high inflation, large recent currency depreciations and/or capital flight/controls. If one zooms into Iraq’s relevant peer group standings (per capita income peers, population size peers or hydrocarbon exporter peers) Iraq’s outlier status is further reinforced.
Iraq’s financial inclusion metrics (see ChartsA1-A5 in the Appendix) go a long way to explaining why overall banking service penetration remains so moribund. For example, consider the following datapoints for 2017 per the World Bank’s Global Financial Development Database:
72% of Iraqis received their private sector wages in cash only
24% of Iraqis do not have a bank account because of lack of trust in the financial system
Only 27.6% of Iraqis deposited cash in their account at a bank in the past year (the lowest of any country globally) vs. 79% in Nigeria
Iraq only has 3.9 ATMs/100k adults and only 4.1 branches/100k adults vs. 30/14.7 in neighboring Jordan
Iraq’s SME loan penetration stands at 0.8% of GDP vs. 15% in Turkey and 8% in Jordan; housing loan penetration is 4% vs. 27% in Iran and 21% in Kazakhstan
Only 2% of Iraqi’s have a credit card (only 6% have debit cards) vs. 9%/79% in Iran
Chart 49: Country Ranking – GDP, Population & Banking Penetration (Iraq vs. Peer Groups)
Chart 50: Private Credit to GDP – Iraq vs. Neighbors & Oil States (2004-2018)
Looking at both Iraq’s multi-decade macroeconomic profile (Chart 51 below) relative to emerging market peers, we see little reason why Iraq’s banking system should not be able to substantially re-rate in terms of size in the coming decade.
Chart 51: Banking Penetration vs. 20-Year Macroeconomic Profiles (1999-2019)
Despite all its past dysfunctionality, Iraq has maintained a reasonably high savings rate of close to 40% (average for 1999-2019), significantly higher than middle income peers in the Maghreb and Egypt and in-line with hydrocarbon EM peers globally. The long run investment rate (gross fixed capital formation for 1999-2019) is low (14.3%) relative to almost all EM peers, yet prospective investment rates will need to rise substantially in order to fund and complete the much-needed infrastructure rebuild. A deep and well-functioning banking system is the ideal conduit for this intermediation between savings and investment. This goes a long way to explain why the low investment rate is more of a symptom of a dormant banking sector rather than a driver. Finally, even though we question the efficacy of the persistent IQD managed peg to the US dollar (one could argue it is no longer an appropriate monetary policy tool while trying to stimulate credit growth), it has nonetheless produced very low historical inflation over an extended period.
Chart 52: Banking Sector Growth Profiles – Iraq vs. EM Peers (2007-2017)
In terms of growth potential for the banking sector and considering where current penetration levels are (Chart 52 above), we see no reason why deposit and credit growth should not also at least double from current levels. Sustaining a 20% annual growth rate in credit for example for the next 10 years (assuming GDP growth of 6%, well below Iraq’s potential growth rate of 7%-8%) would bring Iraq’s credit penetration rate to just 37% by 2030 – still far short of EM peers currently (e.g. 2020 private credit/GDP for Colombia 47%, Russia 51%, Saudi Arabia 54%, Morocco 62%). From a structural profitability standpoint, despite all the regulatory constraints they have been saddled with, the private banks have managed to produce very healthy metrics over the last decade (NIMs of 6%-7%, 2.5% costs/assets, 39% cost/income and returns on assets of 2.9%). This was achieved despite very low operational gearing (only a 29% loan to deposit ratio – by far the lowest in EM) and extremely low financial leverage (most banks were forced to recapitalize in 2015/16 and almost all sit on very high cash balances).
If a full liberalization of the sector is accomplished in the next few years in conjunction with a complete restructuring of the state banking sector, we would expect both the growth and profitability profiles could improve markedly vs. the past 10-year history. This would be driven by: a) lower funding costs – a function of both looser monetary policy and the adoption of a non-exclusive deposit insurance scheme, b) higher credit growth – a function of ‘leveling the playing field’ with state banks by allowing private banks to lend to the dominant SOE sectors, c) higher fee income – a function of liberalizing TBI’s monopoly on LCs and allowing private banks to process public sector payrolls and transfers, and d) lower credit risk cost – a function of the implementation of a national credit bureau platform and enabling private banks to grow more diversified credit portfolios.
We believe that a conservative upside scenario from the higher credit volume and interest revenue alone (b-above) could create at least $10 billion in NPV of equity value for the Iraqi banking sector in the next decade to 2030 (this assumes a 5% NIM, 20% CAGR credit growth off of a $25bil lending base in 2020). If you then add to this a normalized level of non-interest income (c- above; assuming a 35% fee vs. 65% interest income mix), this would add another $5.4 billion in fee income to the overall NPV with a total of $15.4 billion in net present value created to 2030. Relative to what we estimate as the current aggregate value of equity for all listed private banks in Iraq as of 12/31/2019 of $5 billion – the magnitude of upside potential for the banks starts to emerge.
This conservative upside analysis only assumes a relatively mild normalization of growth and profitability and does not factor in any kind of post 2030 cash flow stream or terminal value for the franchise. Under a more functional and liberalized environment, we would expect that they (as a group) would not only grow their current share of the pie (~25%-30% of deposits, much lower in terms of credit share), but would also claim a far larger share from the zombie state banks. One only needs to look at a few analogs across frontier & emerging markets to appreciate the potential from a rebalancing between private and public banks. Leading banks in Egypt (e.g. CIB) and Nigeria (e.g. GTB) grew their relative shares of their respective banking sectors 3- to 4-fold over a span of less than 15 years – mainly at the expense of the legacy state banks. We would not be surprised to see a similar phenomenon play out in Iraq, where leading private bank franchises grow 2x-3x the rate of the overall banking sector, despite new entrants or disruptive technologies (e.g. mobile banking). The upside is tremendous.
While banking liberalization and the restructuring of the Iraqi state banks are major endogenous catalysts to watch for, it is also important to keep the exogenous side in mind. Beyond just the overriding global cost of capital considerations (the level of US$ interest rates for example underpins and drives the cost of capital and funding costs for most emerging market banking systems, especially those that are structural importers of capita) it is also important to keep an eye on valuation ratings and overall foreign investor sentiment for emerging market banks. With net interest margins shrinking and overall cyclical credit growth slowing across most of EM, flows into banking stocks and the ratings paid for these franchises have de-rated since 2014-2016 (see Charts A6-A10 in the Appendix with separate historical profiles for GTB-Nigeria, Sberbank- Russia, Bancolombia-Colombia, HDFC-India and CIB-Egypt). Banks that commanded well above 2x P/BV in 2015 now trade at much more modest multiples, consistent with their de-rated growth and returns on capital of late.
Beyond just the intermittent domestic cycle-driven ratings, it is also important to look at secular capital flows into and out of emerging market banks. Looking at the last 2 decades (with 20/20 hindsight), the period spanning 2002 and 2008 marked a major inflow into emerging markets in general and their banking stocks in particular. In many of these markets, these flows were extraordinary, while in some cases these markets received the attention of large foreign institutional investors for the first time. We like to refer to this phase in emerging markets as the ‘discovery phase’ since investors tend to be the most ebullient when they discover something new. When the global liquidity and risk environments are conducive for flows to emerging markets and a discovery phase begins, this invariably ends up morphing into herd-like behavior that creates such a massive wave of liquidity which in turn elevates all ‘boats’. In our 25 years of covering emerging markets, we have yet to witness a more powerful wave of inflows into emerging and frontier market equities.
We decided to take a closer look at this unique period and sampled 14 separate EM ‘discovery’ bull market cases during 2002-2008, analyzing the performance and ratings of a single leading bank in each of these countries (see Charts 53 & 54 below). On average for these 14 banks, stock prices (in US$s) compounded at over 84% (16.5x) while total US$ returns (inclusive of an average dividend yield of 6%) compounded at 90% (19x). This performance was underpinned by a 50% annualized growth in book value, a 50% growth in post-tax earnings and a 2% appreciation of local currencies vs. the US$ (only in 4/14 cases did the local currency depreciate vs. the US$).
With bank stock returns far eclipsing fundamental growth, ratings obviously played at least an equal part in driving returns. On average, P/BV ratings rose from 2.1x to 6.0x while P/E ratios rose from an average of 11x to north of 24x. Through this short 5-6-year period, returns on capital were high but stable (21% to 23%) – so the fundamental backdrop was ultimately not the biggest driver of returns. In retrospect, what seemed to drive the ratings-part of the equation was the expectation of significantly higher growth, driven in part by a re-rating in overall credit penetration. It is therefore noteworthy that on average, private credit/GDP rose from 25% to 34% during this period, with several countries in the sample witnessing a close to doubling of their penetration rates (e.g. Hungary, Kazakhstan, Russia).
The attribution analysis of returns obviously varies by country, but the single most important takeaway for us from this analysis is how powerful the sentiment-driven flows were in driving the resulting stock returns. Testament to this is that some countries (e.g. Egypt, Indonesia, Sri Lanka, Peru, Kenya) had low-to-negative penetration deltas during this period with returns on equity even falling in some cases. Despite this, the re-rating in valuations more than made up for these shortfalls. A huge wave lifts all boats.
Chart 53: Emerging Market Bank ‘Discovery’ Bull Markets (2001-2008)
Chart 54: Emerging Market Bank Stock Prices Indexed (2001-2020)
Fast forward to the present day (2020), and despite the five year period post-2015 slow-down in growth, lower profitability and (most importantly) de-rated valuation multiples, most of the sampled bank stocks are still factors higher than where they were in 2002 (see Chart 54 above). Even for those that have performed the worst since 2015 (e.g. MCB-Pakistan, GTB-Nigeria, Rajhi-KSA), their stocks are still 6.8x, 7.0x and 5.3x above their 2002 levels, respectively. The approximately two-decade US$ returns since the beginning of each stock’s discovery cycle in 2002 have averaged over 14% on an annualized basis, arguably well above the average cost of capital. In some cases (e.g. Rakyat-Indonesia 19%, Credicorp-Peru 18%, or Sberbank Russia 17%) their two-decade returns far exceed their respective country risk-adjusted cost of capital, thus producing compelling risk-adjusted EVA over a long horizon.
The lesson for us here, especially when looking at the Iraqi bank investment thesis, is that the investment entry point is really critical. In retrospect, it is important to deploy capital ahead of an anticipated ‘discovery’ phase, even if one risks getting in a few years too early. The prospective returns post ‘discovery’ are so large that they overwhelm the opportunity cost of waiting for this powerful wave. On the flip side of the equation, getting in late (in the midst or even later in the narrow ‘discovery’ phase horizon) materially reduces the expected IRR. The entry point timing and having patient capital to hold on for an extended period (up to 2 decades) – are huge comparative advantages for investors looking at pre-discovery opportunities like bank stocks in Iraq.
Capital Markets
Finally, it is worthwhile stepping back and gaining a current perspective on what the capital markets backdrop in Iraq looks like now (see Charts 55-57 below). Iraq is a typical pre-discovery frontier capital market in that the investable, publicly traded asset classes (whether they be equities or fixed-income, domestic-listed or foreign traded) are small, illiquid and extremely narrow in scope.
On the fixed income side, Iraq has issued several reasonably-sized sovereign Eurobonds post the successful Paris Club debt restructuring in 2004 (which ended up with an 80% debt reduction of the ~$130bil in total debt as of the end of 2003). Despite these issuances, Iraq’s sovereign debt stock as of the end of 2019 remained largely bilateral and concessional. As of 2019, Iraq had only $5 billion in tradeable foreign public debt (Eurobonds) and $36 billion in local IQD debt (almost exclusively held by local institutions). The remainder of the debt (total debt ex-reparations was $113 billion in 2019) is owed to the Gulf States ($49 billion) and to Paris Club and non-Paris Club bilateral creditors ($24 billion). Despite the relatively small size of Iraq’s sovereign Eurobonds, they remain today the most liquid and investable Iraqi asset class and most likely the class where foreign capital is most exposed. Iraq’s 5.8% 2028 bond ($2.7 billion in face value) is liquid and trades regularly by the likes of Templeton, Blackrock and Fidelity. On a full return basis, the bonds have compounded at 15% over 5 and 10 years, with the bulk of returns emanating from compounding interest (over 10 years, capital gains have returned only 0.5%). The bonds are unsurprisingly volatile, with 5-year credit default spreads fluctuating wildly in the last 10 years and a recent trading range of as low as 300bps in mid-2019 to as high as 1370bps in April of 2020.
Iraq’s local equity market shares similarities with the fixed income side in terms of breadth and depth but is dramatically smaller in size and much less liquid and therefore barely investable for foreign investors. Like most stock markets at this early stage of development, the equity market is very narrow in scope (106 stocks listed, of which only 61 trade regularly). The market is dominated by two telecom stocks (collectively 48% of total capitalization) where one has a tiny free float (5%) and trades rarely. Banks make up 43% of the notional capitalization, but only 10 listed banks (> $80mil in MC) enjoy a primary listing and trade regularly. The remaining 10% of the market’s capitalization is split amongst a few dozen industrial, service and tourism stocks of which only 1-2 trade regularly. All together, we estimate that only 7 stocks trade more than $50,000 on average per day in US$ (‘$ADTV’) with a collective market capitalization of $2.9 billion. In theory, this is a low threshold definition of the investable equity class for Iraqi stocks. This small group of stocks represents a MC/GDP ratio of 1.2%, while using the total notional size of Iraq’s market’s capitalization would yield a 4.7% ratio. Whichever way one slices it, Iraq’s stock market is tiny.
Nevertheless, Iraq has had quite a few foreign investors visit the country and analyze the larger more transparent listed companies over the years. Despite this, there has been scant improvement in terms of foreign ownership levels or liquidity trends. One of the key reasons for this extreme apathy and neglect is the fact that Iraq still has not passed sufficient capital market reforms that deal squarely with share custody for foreign investors. Despite having several top-notch brokers, a reasonably well-run stock exchange and a functional central depository, the country has not been able to attract foreign global share custodians to onboard local custodian (banks) or the central depository onto their networks. After ten years of asking the question of why this has yet to be accomplished, we rarely get a straight-forward answer from anyone in the ecosystem. If we had to guess, the primary reason likely stems from the fact that capital market reforms (along with potentially game-changing state banking reforms) have commanded a far lower priority for past governments. We would however argue that they are missing the plot. As with the long-delayed reform of the state banks, it is critical for the government to de-bottleneck these important and systemic conduits of capital for the private sector. Responsibility for past decades of extreme capital starvation of the private sector lays squarely on their shoulders.
Chart 55: Iraq’s Capital Markets Overview (September 2020)
In light of the small size, low liquidity, low foreign participation, large hurdles for investment and low breadth, it is unsurprising that returns for Iraqi equities have been horrible overall. Add to this the years of transition since 2003, the ISIS insurgency and the volatile growth and lackluster reform backdrop, and the return profile is predictably poor. The Rabee US$ Iraq Equity Index has compounded at -4% over the past 10 years (-11% over 5 years), during a period where the IQD has effectively been pegged to the US$ and oil export revenues for the state grew at 16%. Virtually all of the top tradeable stocks share a similar profile of returns, with the lone exception of Baghdad Soft Drinks or ‘BSD’, a Pepsi bottler ($450mil MC, 16% of the investable listed names, commands a 58% market share of carbonated soft drink volumes or ‘CSD’) which has compounded returns at 10.5% over the last decade (Chart 56 below). All the others single name stocks have negative return profiles during this period. Many companies (and quite a few banks) have failed or have been downgraded/de-listed in the interim.
Chart 56: Iraq Capital Markets – Asset Class & Major Stock Performance (2010-2020)
With regards to valuation, the bottom up profile is somewhat bifurcated between the severely underperforming banks (and other smaller neglected stocks) and a pair of larger capitalization stocks (Baghdad Soft Drinks & Asiacell Communications or ‘ASC’). The latter pair of stocks trade at reasonably discounted valuations vs. EM peers (P/TBV of 1.3x for BSD, 2.2x for ASC). Listed banks trade in a low range of 0.1x – 0.7x P/TBV, with several trading at a small fraction of cash-tangible book.
While we share the enthusiasm for growth prospects for the food & beverage and telecom sectors in Iraq, this is tempered by the fact that both sectors are far more penetrated than the banking sector. Mobile telecom penetration and usage rates are now at or near GCC levels while CSD penetration levels are expected to have eclipsed Turkish consumption rates. According to Coca Cola Icecek ‘CCI’ – a Turkish bottler that owns/manages the Iraqi Coke franchise with a 42% duopoly market share, per capita CSD consumption in Iraq was 57 liters/capita vs. 56 for Turkey in 2019. For BSD, even if it is eventually able to command the same stock valuation rating as its Turkish counterpart while growing volumes in line with GDP growth (5%-8%), this would translate into an expected return from current levels of only ~35%. If one assumes a normalization of BSD’s capital structure (it has no debt and sits on cash of $70mil), the upside from a release of excess capital via dividends could potentially even double this upside. In comparison to the kind of upside potential we expect from the top private banks (see above in the Banking section), BSD’s potential returns, while attractive and carrying a lower risk profile, pale in comparison to the conservative upside scenarios for Iraq’s banks.
Chart 57: Global Markets: Market Capitalization to GDP vs. GDP Per Capita (2020/2019)
Tying all of this together for Iraq’s stock market, it is always informative to look at the top-down aggregate stock market valuation relative to GDP and compare this to other stock markets globally across the per capita income spectrum. Commonly referred to as the Buffet Indicator, this ratio is a very broad market-level valuation metric that is akin to a price/sales ratio for a stock, as is usually much more informative when studying trends in a country’s stand-alone history (attributing changes in both the numerator and denominator over time) – see Chart 57 above). In a static, cross-sectional manner, it is more useful in highlighting which markets are over- or under- represented in their respective economies. If stock market representation in the country’s GDP is assumed to be similar (which is a dangerously misleading assumption for most narrow emerging markets), then the indicator can shed some light on relative valuation (whether relative to history or relative to other markets).
Despite all these caveats, we still find it useful to look at this chart every once in a while, in very much the same vein as one looks at a static map. Whether you use Iraq’s total notional market capitalization ($10.9 billion) or the market capitalization of primary market listed stocks that trade regularly ($2.9 billion) – Iraq’s MC/GDP ratio (4.7% or 1.2%) is one of the lowest (if not the lowest) ratio globally and a far departure from either the frontier markets average (15%) or for that matter the emerging markets average of 27%. Iraq’s stock market’s unflattering position on this map has not shifted much in the past decade since we have plotted it. It is high time that it does.
This is especially true in light of Iraq’s huge needs for capital in the coming decades. This capital will be needed to fund enabling and productivity-enhancing infrastructure. The sovereign debt markets will obviously be Iraq’s first port of call, but the country’s capital needs far exceed the sovereign’s capacity to borrow (both in the short- and long-run). Therefore, it is paramount that Iraq develop its private domestic capital markets. Doing so will not only create a large and scalable funnel for capital (domestic and foreign), but as the Iraq’ corporate sector grows, the corporate tax base will grow with it. This in turn will enhance the tax base of the sovereign and allow it to raise capital at a much lower cost and with greater capacity. To illustrate this virtuous cycle, Warren Buffet when queried about the U.S. sovereign debt profile at the Berkshire Hathaway 1995 Annual Meeting (around minute 1:47), urged the questioner to consider the ‘asset side’ of the U.S. sovereign balance sheet, not just the liability side (net debt to GDP for the US was around 60% at the time):
“What would you pay today to have the right to receive all the future corporate tax payments of all US companies? You would pay a big number. What would you pay today to have the right to receive a certain percentage of the income of every US citizen earning over x and the right to change the percentage as you went along? That’s a very big number too. The [US] is very solvent!”
Like many developing countries with shallow private corporate sectors and nascent capital markets, the narrow tax base that is a consequence of this ends up restricting the country from funding its ambitious capital investments.
Conclusion
As we stated earlier on in this note, we are staunch believers in the power of adversity to act as a potent driver for transformational change. Countries rarely transform when they can – but do so only when they must. However, in order for transformational reforms to even be considered, let alone adopted and implemented successfully, a functional state needs to pull itself away from the precipice before it collapses. The interests of all the major stakeholders need to be aligned and a sustainable path forward needs to be identified and mapped out by strong leadership that ultimately rises to the occasion.
In many cases, one of the most powerful incentive alignment mechanisms for nations is the experience of watching a close ally or neighboring country tragically fall off the metaphorical precipice and summarily devolve into a failed state. While Iraq was at several junctures in its recent history a vivid example of this for its own neighbors, the table can now also be turned around with Iraq looking outward and witnessing firsthand what to avoid and the consequence of inaction. Iraq now has many examples of failed states in its own immediate backyard, from Syria (the source of the ISIS insurgency, caught in what seems to be an un-ending civil war) to a meddling and intransigent Iran, to a sectarian-divided, dysfunctional and uber-corrupt Lebanon.
If there is one chart that illustrates this metaphorical precipice best, it is the one below (see Chart 58) which plots the US$ value of the Iranian Riyal, Syrian Pound and the Lebanese Lira, indexed back to 2002 (we pieced together official exchange rates to the US$ and the black market rates post FX dislocations). The “Free Market” Iranian Riyal has lost 96.7% relative to its 2002 value, the Syrian Pound 97.6% and the Lebanese Pound (measured by the black-market rate) close to 82%. Arguably, each of these currencies represents a narrow but important measure of a citizen’s faith in their own leadership’s ability to govern and reform. With all three countries now battling rampant inflation, high dollarization and some form of capital controls, these currency rates also represent a blunt measure for the real national wealth of its citizens. If there is anything akin to a report card for these countries over the last 2 decades, this is as good as any.
Iraq, many of its neighbors and quite a few of the Arab spring countries are now facing what Emma Sky describes as a deep and profound ‘crisis of legitimacy’, which has culminated in uprisings in several countries that are led by the educated, informed and empowered youth for the most part, and not by religious or sectarian political groups. There is widespread acknowledgement that the old ‘unsocial contact’ for most of these states, and especially for Iraq, is broken and needs to be re-written in a much more inclusive fashion, while governance needs to be more transparent and far more accountable to all citizens. Iraqi citizens of all stripes are now demanding to reclaim their liberty with a loud demonstration of self-determination, something that has been absent in most Arab societies since at least the start of the post-colonial period.
This pursuit of liberty is eloquently described by Daron Acemoglu and James Robinson in their recent book “The Narrow Corridor” in terms of the ultimate solution to what the authors refer to as the “Gilgamesh Problem” – quite appropriately a 4,200 year-old epic tale of the king of Uruk (now part of modern day Iraq) where a “despotic leader creates a powerful state, but then uses it to dominate society, sometimes with naked repression“ (emphasis is ours):
“Liberty needs the state and the laws. But it is not given by the state or the elites controlling it. It is taken by regular people, by society. Society needs to control the state so that it protects and promotes people’s liberty rather than quashing it….Liberty needs a mobilized society that participates in politics, protests when it’s necessary, and votes the government out of power when it can…for liberty to emerge and flourish, both state and society must be strong. A strong state is needed to control violence, enforce laws, and provide public services that are critical for a life in which people are empowered to make and pursue their choices. A strong, mobilized society is needed to control and shackle the strong state….checks and balances don’t solve the Gilgamesh problem because, without society’s vigilance, constitutions and guarantees are not worth much more than the parchment they are written on.”
“Squeezed between the fear and repression wrought by despotic states and the violence and lawlessness that emerge in their absence is a narrow corridor to liberty. It is in this corridor that the state and society balance each other out. This balance is not about a revolutionary moment. It’s a constant, day-in, day-out struggle between the two. This struggle brings benefits. In the corridor the state and society do not just compete, they also cooperate. This cooperation engenders greater capacity for the state to deliver the things that society wants and foments greater societal mobilization to monitor this capacity.”
“What makes this a corridor, not a door, is that achieving liberty is a process; you have to travel a long way in the corridor before violence is brought under control, laws are written and enforced, and the state starts providing services to its citizens. It is a process because the state and its elites must learn to live with the shackles society puts on them and different segments of society have to learn to work together despite their differences. What makes this corridor narrow is that this is no easy feat. How can you contain a state that has a huge bureaucracy, a powerful military, and the freedom to decide what the law is? How can you ensure that as the state is called on to take on more responsibilities in a complex world, it will remain tame and under control? How can you keep society working together rather than turning against itself, riven with divisions? How do you prevent all of this from flipping into a zero-sum contest? Not easy at all, and that’s why the corridor is narrow, and societies enter and depart from it with far-reaching consequences.”
Viewed through this intellectual lens, Iraq may be somewhat unique in the Arab World at this particular juncture in that it is arguably farther along in the iterative and messy process of travelling through this “narrow corridor” between Iraqi society and the Iraqi state. Iraq’s journey through this corridor will no doubt be a long and difficult one. One thing that truly sets Iraq apart from other stagnant societies in the region is that this journey is now fully animated and quite dynamic. Iraqi society’s determined pursuit of liberty through self-determination may in turn be the strongest anchor for this process to continue and for Iraq’s journey through this corridor to be sustained.
On the economic front, Iraq today continues to face massive structural challenges: near economic collapse due to the global drop in demand for oil caused by both the COVID pandemic and the surplus of supply from the “oil war” between Russia and Saudi Arabia. The economy was weak before these crises began, with moribund non-oil growth, rising twin deficits and sharply declining foreign reserves. Over the years since 2003, efforts to tackle Iraq’s myriad of development challenges have been severely hampered by sectarian power grabs, insecurity and extremely poor governance, with economic decision-making dominated by short-termism and rent-seeking tendencies. The post 2003 strategy of prioritizing the hydrocarbon sector at the expense of all others in order to finance a bloated public sector and current spending needs (mainly via public sector wages) are completely detached from any serious long-term diversification strategy. Add to this the fact that Iraq (like many of its Arab spring cohorts) also faces huge demographic pressures, quickly deteriorating social development indicators, labor market dislocations, endemic corruption and severe infrastructure deficits, all of which continue to fester due to over dependence on resource rents, a degraded and neglected private sector and a shallow and dysfunctional banking system.
It would be an understatement to say that the Iraqi story of the past few decades is in so many ways a real-life tragedy. But Iraq doesn’t need to continue to follow the script of a classic Shakespearean tragedy that has such a predictable conclusion. Most of the ingredients for a well-anchored, reform-led transformation are present. Some of these ingredients are still work-in-progress foundational building blocks that require resuscitation or further reform, while some are core national comparative advantages that have only become stronger and more resilient in the context of extreme and prolonged adversity.
A contrarian perspective may offer a different potential path forward. Each one of Iraq’s seemingly insurmountable obstacles can be turned on its head to represent a huge untapped opportunity to change the past narrative and harvest what we believe to be low hanging fruit. Whether this translates into accelerating investment in infrastructure, reforming the bifurcated labor market, arresting rampant corruption, downsizing the state apparatus, breathing life into the private sector or jump starting the dormant banking system and capital markets – all of these various levers are primed for transformational change. Both Iraq’s immediate and existential challenges have elevated the country’s risk profile materially of late, exposing the dire consequences of inaction. The biggest dividend from this extreme level of adversity is that it has elevated the urgency for positive change. If Iraq is in fact approaching its own catharsis moment, it may finally seize the opportunity to turn tragedy into transformation.
Appendix:
Table 1 – Iraq Key Events & Period Pivots
Table 1 (contd.) – Iraq Key Events & Period Pivots
The last few times GCC pegged currencies like the Saudi Arabian Riyal (SAR) were this dislocated, they were ‘saved’ by a reversal in oil prices or the US$ (or both). Time will tell if history repeats itself. One thing is for sure though – the current environment is not a great cocktail for the SAR/$ peg (or any of the other GCC pegs for that matter).
Proponents for keeping the peg will rant off the same templated rationale we’ve been hearing for years: 1) Saudi really only exports one thing – US$-priced & hydrocarbon-derived energy (whether in the form of oil or oil/associated gas-by-products like petrochemicals and fertilizers) while importing everything else under the sun from cars to industrial parts to migrant labor, to food & water (through protein). This narrative argues that a devaluation really will not help the balance of payments in the short run. And 2) The pegs have served the GCC countries well in the past as they have created visibility and stability for local and foreign investors alike- but especially for foreign direct investment which is a key objective for the success of the Saudi 2030 vision (Saudi needs all kinds of foreign capital, not just financial, but more so intellectual). We believe both assertions are mere rationalizations (at best) and distractions from what really matters (at worst).
Goldman Sachs last week came out unsurprisingly (they were one of the lead bankers to the PIF on the Aramco IPO) as a cheerleader of the status quo, saying that the US$ peg “has been of significant benefit to the Saudi economy over the years”, and that “unlike a devaluation, fiscal policy can shift the burden of adjustment on those more capable of bearing it through, for example, taxes on luxury goods”. Goldman’s report goes on to say that “this is not to say there would be no economic or sociopolitical costs [of a purely fiscal adjustment], but we believe these would be lower than in the case of a devaluation.” Even the IMF recently chimed in saying that Dollar pegs in the Gulf have been “serving [the GCC] very well, and [are] still appropriate, especially countries who have buffers that have the ability to use their reserves in order to address the shock.”
However, what both of these esteemed organizations gloss over is the key element of competitiveness and the ability and incentive for rapid diversification that a dollar peg inevitably kills. By stubbornly tethering the value of the SAR to an ever appreciating US dollar, the Saudi currency is forced to appreciate in real terms (see the REER Index below in Chart 1 which puts the SAR at at least 30% rich vs. fair value) and as a result, renders the currency even less competitive to its regional and global peers who maintain some form of currency independence from the USD and thus are able to adopt counter-cyclical policies.
The peg also creates a very tight straight-jacket on the Kingdom in terms of policy flexibility. Consider the options any country with a pegged currency has to adjust to a big fiscal and balance of payments shock that may also face borrowing constraints at some point in the future: a) lower deficits by cutting spending and/or increasing current revenues – mainly through current taxation, b) borrow more debt to fund the deficits (effectively an increase in future taxation) or c) inflate away your existing debt (which is in effect taxing your past savings).
Option c) is effectively off the table since since the $-peg anchors you blindly to US monetary policy and inflation. Tightening the fiscal side (a) is precisely the wrong type of policy during an external shock like a pandemic, since in order to stimulate growth, a country like KSA needs to adopt aggressive stimulative policies (higher spending/lower taxes) in order to allow growth to recover. If you are constrained in expanding your fiscal revenue base, you are left only with option (b) as an exit valve, which means your sovereign gearing will increase at a very accelerated pace as you fund rigid and increasing deficits.
Today, Saudi showed its policy hand by announcing a tripling in the VAT (from 5% to 15%), cutting public sector cost of living allowances and reversing large employment & salary increases (for both public and private sectors) while also unilaterally cutting oil production. The cut in production is somewhat ironic since it is an about-face after the disastrous oil price war with Russia that began just two months ago yielded little in terms of net revenue gains. With a relatively inflexible public sector wage bill, a very low tax contribution to the fiscus and lower oil revenues, these steps are unlikely to yield enough savings to really move the needle in suppressing high debt stock accumulation. So, what is more likely to occur is the classic ‘two steps back’ (debt accumulation in a low growth environment that will likely persist as the economy’s capacity shrinks and a drawdown in reserves ensues) and ‘one step forward’ (small savings from ill-timed fiscal austerity).
This all begs the bigger question: why should the Kingdom continue to abdicate its sovereignty over monetary policy and exchange rate flexibility and competitiveness, just to protect the peg? Who/what does the peg really serve most? Is the peg really sacrosanct because of the potential impact it may have as a regressive tax on KSA’s citizens or is it really protecting the wealthy classes who benefit most from the status quo? In more ways than one, a cheaper currency may in fact allow the country to level the playing field as to resource allocation, shifting more resources and investment away from hydrocarbons.
Imagine what a more competitive SAR could produce for the Kingdom: 1) a much needed boost for non-hydrocarbon-linked industrial exports & services and high value added or R&D intensive technology which are currently not competitive, especially vs. regional peers like Egypt or Morocco who both have far more competitive currencies, and 2) a much needed lever to inflate local SAR debt, depreciate SAR spending & operating expenses, thereby materially lowering the Kingdom’s overall fiscal break-even level for oil exports (akin to what Russia did successfully in 2016). Evidence from the last two decades of policy inaction is that the status quo has failed miserably in diversifying away from extreme oil-dependence (see the level and trend in non-oil revenues and non-oil deficits below in Charts 6 & 7) – both expected to deteriorate markedly in 2020/21 by the IMF as they have proven to be much more inter-linked with the oil economy (via government spending) than most would admit.
In the meantime, and assuming the persistence of the peg, how much will Saudi Arabia and the rest of the GCC central banks spend (and waste) from their precious reserves and offshore savings to defend pegs that serve no real tangible purpose other than to maintain a regime that no longer serves any real economic purpose? The folks at Goldman estimate that Saudi Arabia has some room in terms of existing reserves to maneuver and point to a $300 billion minimum threshold in net reserves to cover the monetary base. But should this reactionary and defensive calculus really be the right sustainable policy direction for the Kingdom?
If Saudi Arabia were a company, would it be wise to allow the balance sheet to deteriorate at such a fast pace through reserve depletion (arguably the main source of anti-fragility) and massive debt accumulation (a future tax on the next generation) just to protect a peg that has lost all its efficacy (assuming it ever had any)?
We are all proponents for the structural reduction in the fixed cost base (KSA is amongst the world’s top spenders on arms/military as a share of GDP, high and overly generous public sector wage spending, costly and distortive energy/water subsidies, huge ‘white elephant’ projects), but should not these measures also be accompanied by higher spending on productive and essential human capital categories (education, healthcare) or productivity-enhancing infrastructure? A depreciation of the SAR at this juncture would provide the Kingdom with much needed fiscal space and the flexibility to more aggressively reallocate their fixed cost structure. It would also go a long way in relieving the pressure on reserves at a time when capital is dear. Why is this not a policy option that is legitimately on the table? We have yet to hear a compelling reason.
If oil prices do remain low for the foreseeable future (next 2-3 years), these kinds of voluntary options may disappear from KSA’s toolkit, especially as the forces of negative operating leverage accelerate (revenues from hydrocarbons falling precipitously, while fiscal costs remain stubbornly fixed). This in turn can lead to an accelerated drop in cash flows and a ballooning of debt – both at a much faster pace than most expect.
Why postpone the hard decisions to when your options are more limited and your hand may be forced?
Note to Readers: For a better viewing of charts, please right click the chart image and open as a new window to view in full resolution.
Chart 1 – Saudi Riyal REER, US dollar Index, Oil Prices, Saudi International Reserves (1990-2020)Chart 2 – Saudi Arabia Main Macroeconomic Indicators (1990-2020)Chart 3- GCC Government Debt / GDP (%) – 2000-2020Chart 4 – Saudi Arabia External & Fiscal Breakeven Oil Prices (2008-2021)Chart 5 – Saudi Arabia Oil Production & ExportsChart 6 – GCC Non-Oil Revenues as % of Non-Oil GDP (2000-2020)Chart 7 – GCC Non-Oil Fiscal Balance as % of Non-Oil GDP (2000-2020)
A ranking of population densities of major urban cities worldwide (UN data for city centers with populations > 7 million) sheds some light on which major cities will need to urgently address some of the challenges of contagion presented by the ongoing COVID-19 pandemic.
While most of the press focus has been mainly on developed country urban centers like New York & Paris, it is worth noting that the New York Metropolitan area (18.8 million pop, 11th largest city agglomeration) ranks only 55th globally in terms of population density of 1,800 persons/square kilometer. Densities are tricky though – since for NY, if you drill down to just the Island of Manhattan-New York (1.63 million of the total population of 18.8 million for the metropolitan area, but with only 59 sqkm of area for the Island of Manhattan vs. 34,000 sqkm for the bigger metro area), then density rises to as high as 27,544/sq km- ranking it 7th worldwide and 4th amongst large urban cities worldwide. Likewise for Paris and Los Angeles with city center densities 5.5x to 7.0x their respective metropolitan area densities.
Note to Readers: For a better viewing of charts, please right click the chart image and open as a new window to view in full resolution.
Chart 1 – Population Densities & Size: Megacities (Populations > 10 million)Chart 2 – Population Densities & Size: Large Cities (Populations 5-10 million)Chart 3 – Population Densities & Size: Large City Centers (Populations > 100,000)
What is abundantly clear from the global city density rankings however is how prevalent high city densities are amongst developing country urban centers. South Asian and East Asian metropolitan cities make up the bulk of highly dense large urban centers, with most city densities at a factor higher than New York City. First-ranked Dhaka has a density of 44,000 and is 24x more dense than New York City (1,800), though Dhaka, with an area of just 307 sqkm, is less than half the size of NY City’s 784 sqkm of area and only 1% of NY Metropolitan area. The likes of Mumbai (600 sqkm, 32,300 density) and Dhaka are themselves quite concentrated megacities with less urban sprawl outside the central urban center – so density gaps between their metropolitan and city centers is dramatically lower. Only 8 of the top 40 most dense city centers are in the developed world, while over half (24) are in South or East Asian developing countries.
Chart 4 – International Tourism Arrivals as a Percent of Population vs. Tourism Receipts as a Percent of GDP
One of the factors that potentially may shield many of these emerging cities is the small size of their airport infrastructure and tourism absorption capacity. As a proxy for city-level tourism arrival traffic, we looked at national-level tourism arrivals as a percent of total population (Chart 4 above). Most developing countries have ratios well below those of developed European countries, Japan and the US (25% for the US to as high as 300% for the likes of Greece). However, those developing countries and city-states that have invested aggressively in expanding airport infrastructure capacity in the past 2-3 decades (Hong Kong, Singapore, UAE, Thailand) and countries that have a large diaspora population that visits their home countries frequently (Jordan, Morocco, Tunisia, Lebanon, Israel) – all have a high in-bound travel incidence ratio. Developing countries that are very dependent on inbound migrant workers (GCC, several of the CIS countries) are also quite exposed due to the large migrant traffic inflows. Finally, there are the small-medium developing countries that depend on tourism as their main engine for employment and growth as evidenced by a high tourism receipts/GDP ratio (Caribbean States, Georgia, Croatia, Cambodia, Jordan, Lebanon, Morocco, Portugal, Greece, Hong Kong, Thailand) – all earrings in excess of 8% of GDP from tourism while tourist arrivals as a share of local population is 50% or higher. These countries were quite exposed to the pandemic because of the high velocity of travel in the months preceding March 2020 while their economies will remain quite dependent on tourism as an engine for growth during any slow recovery period. The longer their lock-downs and travel bans stay in place, the more exposed their economies will be to severe downturns and high unemployment.
It is important to note that these are country-level proxy assessments, which like densities, may mask very high openness vulnerabilities on the urban center level. New York Metropolitan is a case in point. New York Metropolitan area airports inbounded 50.5 million international passengers in 2018 according to the Port Authority of NY & NJ (34 million into JFK alone). This is 270% of the local population, placing the New York Metropolitan area in the same exposure level as Singapore, Dubai-UAE, Ireland and Greece. One can make the same general assessment for cities like Beijing, Tokyo, Frankfurt, London, Amsterdam, Munich, Paris, Amsterdam, Istanbul, Jakarta, Los Angeles and Chicago – all of which have annual passenger arrivals well north of 60 million per annum (Chart 5 below).
Chart 5 – World’s Busiest Airports by Passenger Traffic
Even though most of the the developed world may be more open to travel and tourism flows vs. developing countries, they are for the most part much more prepared for the pandemic in terms of health infrastructure and crisis management systems and institutions. The developing world for the most part (Russia and the FSU countries are big exceptions) have very inferior health and emergency response infrastructure (see Chart 6 below).
Chart 6 – Hospital Beds & Physicians Per 1,000 Population
With already stretched healthcare systems for most countries, this pandemic will present a monumental challenge in emergency response and containment, especially for emerging market mega cities (> 10mil) where 30 of the 34 top cities are in developing countries. Middle East, Africa & Southern Asian (MEASA) countries are especially vulnerable to the expected stress from the COVID-19 pandemic due to weak healthcare infrastructure and systems. Sub-Saharan African (SSA) countries account for 23 of the bottom 50 globally in terms of hospital bed capacity (beds per 1k pop), while five of the six South Asian countries also rank in this category. In terms of physicians per 1k pop, SSA countries make up 30 of the bottom 50, with all countries scoring < 0.50 physician/1k pop (S. Africa is the highest at 0.83). This is not surprising in light of most countries’ tight budgets, though one would expect richer countries like S. Africa and Angola to fare far better.
Turning to rich countries in the GCC with highly developed infrastructure (generally) and very generous fiscal budgets, if one looks at bed or physician per pop relative to what these countries spend on military expenditures per pop (Charts 7 & 8 below) – they are complete outliers (along with the US, Israel & Singapore) – reflecting the disproportionate amount of resources they dedicate to military/defense at the obvious expense of basic social needs such as healthcare.
Lets hope the allocation of resources shifts markedly in the future – for the ‘haves’ and ‘have-nots’ alike.
Chart 7 – Physicians Per 1,000 Population vs. Military Spending Per Capita Chart 8 – Hospital Beds Per 1,000 Population vs. Military Spending Per Capita
Note to Readers: For a better viewing of charts, please right click the chart image and open as a new window to view in full resolution.
At Jadara Capital Partners, when investing across emerging and frontier markets, we spend as much time analyzing countries as we do analyzing sectors and companies. In emerging market investing, we believe the country risk premium tends to be a driving factor for long run investment returns (and alpha), so solving for the country risk/return metrics becomes an essential part of picking outperforming stocks that don’t get caught up in a bad macro environment.
Much has been written on this subject (see a recent GMO note on the topic titled ‘Top-Down Investing in Emerging Market Equities’) and there is quite a bit of empirical evidence that supports the contention that the top-down factors (currency, macro growth, inflation, governance – to name a few) tend to drive a disproportionate portion of returns over the medium and long term. This is especially true as you go down the efficiency and investability spectrum – the least efficient & least accessible markets (for foreign investors – whether because of liquidity, market size or capital controls) in the least integrated economies across the emerging world, tend to be dominated by domestic-driven sectors and companies (e.g. banks, telcos, food & beverage, cement, etc.) with a very small representation by globally-integrated and competitive industries (technology, MNCs, large exporters). Globally integrated franchises, because they compete on a multinational setting, tend to get benchmarked and valued relative to international peers. More importantly, these companies tend to have a lower exposure to their home market, while in some cases (e.g. exporters) can benefit from a weak local macro backdrop (e.g. weak home currency vs the US$). This is a long-winded explanation for why the top-down is crucial for anyone investing in emerging and frontier markets and why we spend so much time studying countries.
In order to perform country analysis in a systematic and disciplined fashion, we adopted and refined a top-down country framework over the past couple of decades that has worked well for us – not just in picking ‘winner’ countries, but also (and far more importantly) avoiding ‘land mine’ countries that blow up intermittently. We believe investing is mostly about preserving one’s capital from permanent loss while maximizing exposure to high return/risk asymmetric propositions. From a risk standpoint, merely dodging land mines is such a crucial task. We believe if done successfully, just avoiding land mines will get you at least half way to preserving capital and generating competitive returns. The other half lies in the return side of the equation and in picking the big ‘break-out’ countries (to borrow a label from MSIM’s – Ruchir Sharma).
Chart 1- JCP Country Selection Framework
The framework we have adopted (Chart 1 above) is pretty straight forward – 3 big factor categories (Dynamics, Valuation & Sentiment) each with their own sub-factor-categories, some of which are gating factors for us (e.g. Rule of Law & Governance). We will not invest in a country that has poor overall governance (e.g. human rights, socio-economic track record, failing social contract) and will stay clear of countries that do not protect property rights or have weak judicial infrastructure. On the positive selection side, we are looking for countries with a sustainable national comparative advantage that is demonstrated through sector leadership in a global context. This factor specifically addresses the question of ‘what is the country’s overall long run strategy and development model’ and how does the country truly stand out in a global context?
All of the factors are analyzed dynamically- so we are not just interested in where the country stands now across these dimensions (vs. others) but what is the trend. On this last point, analysis of the reform and capital efficiency profiles are quite important. What has the direction and pace of reforms been of late and what really anchors these reform policies (how strong are the anchors?). On capital efficiency, we look at both the availability and cost of capital in the country and study the drivers for abundance or shortage and how the country has managed its growth in light if these factors. Finally, we have a strong overwhelming bias for scalable growth opportunities that are offered by either large domestic markets (big populations) or (in a handful of cases) smaller countries that position themselves as regional or global hubs catering to a large, somewhat captive global markets (e.g. Singapore, Ireland, Hong Kong or Dubai). In the Dynamics category – we are essentially trying to identify (and ‘solve for’) those countries that are successfully undergoing big structural transitions.
The top-down framework is more than just a check list, it is also a road map and is akin to a recipe’s key ingredients. The factors are not guidelines, they are essential bedrocks of analysis that help us concentrate our analytical resources on where we think they will be most effective. The framework is also dynamic – so the grading/scoring can and will change and our convictions and relative scoring will change as a result (we force rank all of our countries against one another every quarter).
In the Valuation category, we are ‘solving for’ the true national cost of capital and therefore the implied risk premium for the country (e.g. relative to the US or a developed world benchmark). This dovetails nicely with the overall country’s culture of capital efficiency, but is empirically analyzed here through aggregate country bond and stock valuations. What have the long run returns on capital been relative to the cost of capital (EVA or ‘Economic Value Added’) in the country in aggregate and relative to its growth profile? Has this competitive EVA been generated despite a high cost of capital (e.g. in capital-short countries like India or Turkey) or is it more a function of abundant & cheap capital that may be subsidized or misallocated? Finally, we decompose the aggregate risk premia into their endogenous components – political/social risks, inflation/currency, debt profile, fiscal profile, and assess their directionality and weights.
We then analyze the third pillar of Sentiment, which tends to be the ‘softest’ factor to assess. Liquidity is obviously both a driver and contributor to sentiment, while research coverage, investor positioning and structural neglect (e.g. capital controls, off benchmark status, “too dangerous to visit”, etc.) are also considered. For each of the big three factor-categories, we then map out visible catalysts for change at the margin along with key milestones that we track closely.
Chart 2- JCP Company Selection Framework
Because at least half of our brains are also picking stocks, it is important that our top-down framework is in sync and almost rhymes with our bottom-up framework (see Chart 2 above). For company selection, we use the same framework structure and factor-emphasis (e.g. scalable growth opportunity, sustainable competitive edge, governance, etc.) which makes the process much more intuitive and consistent for our team (we are all using the same general lens for countries as well as for company franchises). More on this bottom-up framework in later posts; we will focus on top down in this note.
Having described our country selection framework at length and contrasted it to our company framework, we can now address the central question at hand in this post – can or should investors look at countries in the same manner as they look at companies and their stocks?
We obviously believe in the affirmative, but there are two big obstacles that need to be overcome in order to do this effectively.
First, country accounting is very different than company accounting. Country accounting is much more concentrated on flows (e.g. GDP, money supply, savings, fiscal spending, etc. – or akin to the income statement and cash flows of a franchise) and much less so on the asset side of the balance sheet (particularly the capital deployed – or the denominator in any Return on Capital calculus). As a result, country data provides only a partial picture of a nation’s economic health, potential for future growth and (most importantly) how efficiently and productively capital is being deployed. We are all quite familiar with the liability side of a nation’s balance sheet (and some of the transparent financial assets), but don’t have great data on other real assets that make up the bulk of the productive capacity of countries. As a result, we don’t really have a great handle on what a country’s net worth or equity is. This is equally true for resource-intensive countries as it is for service-intensive countries – we don’t really know how the respective national assets are being ‘sweated’. At the end of the day, assets are what enable countries to generate future income and growth. [Don’t even get us started on productivity economics – or ‘TFP’ since we remain big skeptics (topic for another note)].
Secondly, emerging capital markets tend to be very narrow and only represent a very small percent of the total economic picture for most countries. Evidence of this is the low 41% average market capitalization to GDP ratio for EM/FM markets (Chart 3 below, data as of November 2019 which are materially lower now). For many emerging countries, stock markets only represent 5%-15% of their respective GDPs (the ratio itself is inherently flawed as it measures a ‘stock’ – the country market capitalization versus a ‘flow’ – country GDP). As a result, looking only at the capital markets for clues about true capital efficiency and returns only gives you a very small sample of reality, in some cases this can be quite misleading (positive or negative selection bias at play).
Chart 3 – Market Capitalization to GDP vs. GDP Per Capita (Emerging & Frontier Markets) – November 2019
In order to overcome these two obstacles, we have tried to assess the asset- and wealth- sides of a country more holistically. This is, to say the least, a very challenging feat for most countries and an even bigger challenge to try and make an analysis systematic and consistent so that it is credibly comparable across a large set of countries.
Fast forward to 2018, and we were elated to learn that the World Bank had finally undertaken this challenge head on and started to publish data on comprehensive country ‘wealth’ in a report titled ‘The Changing Wealth of Nations’. In the report, the authors define ‘wealth’ as the sum of human capital, natural capital, produced capital and net foreign assets (or liabilities). What is refreshing about their methodology is that it is bottom-up so there is an empirical rigor associated with tabulating and calculating the true stock of assets. Much of this is done by sourcing asset assessments from experts (e.g. national real estate registers or the IEA for hydrocarbon deposits) while the human capital is assessed through detailed labor and household surveys (we can all thank the Gates Foundation for funding these incredibly important surveys in many emerging markets like Nigeria where primary asset data is scant). For readers who want to dig more into this topic but don’t necessarily want to spend too much time – see a good summary posted in 2018 by the folks at Our World in Data.
Below is a detailed definition of each of the major ‘wealth capital’ components (from the World Bank).
Chart 4 – World Bank Definition of ‘Wealth Capital’ Components
This ‘wealth’ figure should at least provide a broad basis for the comprehensive deployed capital of a nation which we will use as a proxy for a country’s equity capital- roughly analogous to the total shareholders’ equity of a company if you consider each citizen a shareholder with political (voting rights) and economic (dividends, capital appreciation) claims to this equity.
That takes care of the denominator for ROC. As for the numerator, we decided to hone in on the Adjusted Net National Income (ANNI) for each country (see below an exerpt from the World Bank’s definition for ANNI):
“Adjusted net national income is calculated by subtracting from GNI a charge for the consumption of fixed capital (a calculation that yields net national income) and for the depletion of natural resources. The deduction for the depletion of natural resources, which covers net forest depletion, energy depletion, and mineral depletion, reflects the decline in asset values associated with the extraction and harvesting of natural resources. This is analogous to depreciation of fixed assets. It complements gross national income (GNI) in assessing economic progress by providing a broader measure of national income that accounts for the depletion of natural resources….and is particularly useful in monitoring low-income, resource-rich economies, like many countries in Sub-Saharan Africa, because such economies often see large natural resources depletion as well as substantial exports of resource rents to foreign mining companies. For recent years adjusted net national income gives a picture of economic growth that is strikingly different from the one provided by GDP. The key to increasing future consumption and thus the standard of living lies in increasing national wealth – including not only the traditional measures of capital (such as produced and human capital), but also natural capital. Natural capital comprises such assets as land, forests, and subsoil resources. All three types of capital are key to sustaining economic growth. By accounting for the consumption of fixed and natural capital depletion, adjusted net national income better measures the income available for consumption or for investment to increase a country’s future consumption. Adjusted net national income differs from the adjustments made in the calculation of adjusted net savings, by not accounting for investments in human capital or the damages from pollution.”
Of all the metrics provided by the World Bank, we found that the ANNI most closely resembles a company’s cash flows since it deducts from gross income (GNI/GNP) the capital expenditures used to replenish fixed and other forms of physical capital (they exclude human capital which is not capitalized). In most cases, the ANNI deviates somewhat from GNI, itself a close proxy for GDP, but includes net income from abroad which can be material for big exporters. This however is only to the extent that the country is a very resource intensive exporter, in which case the ANNI can be meaningfully lower than GDP. In light of the fact that resource assets are theoretically finite and exhaustible, the ANNI is a much more realistic representation of the sustainable income generation of a country.
So with ANNI as our numerator for the ROC calculus, we are now armed with data that will allow us to assess at least a broad comparable metric for return on capital for a country, thereby solving for comprehensive capital efficiency on a holistic national level. Below are a few charts that illustrate these findings.
Chart 5 – ROC Latest (2017 ANNI / 2014 TW)
Chart 5 above ranks countries by national Return on Capital or ‘ROC’ (Adjusted Net National Income or ‘ANNI’ / Total National Wealth or ‘TW’) using the latest data available. The world average is 5.7% which we will conveniently use as our benchmark hurdle. There are some surprises here, especially with several countries that have pursued unsustainable economic strategies. On the top of the ranking, the likes of Lebanon, Jordan, Greece and Argentina all immediately pop out. These countries all binged on debt of late which likely boosted their ROCs unsustainably as of 2014 (we know how most of these stories have played out by 2020). Others that have lower national gearing (India, Philippines and Bangladesh for example) are in the enviable league of high ROC earners due more to growth in ANNI than other factors. The bottom rung is also noteworthy, crowded with big capital-intensive (mainly resource intensive) countries – Russia, Nigeria, GCC states. Many questions surface too: Why is Turkey such a large positive outlier on ROC? Why are the likes of China and Brazil underperforming the World despite above average growth in the past 20 years?
Chart 6 – ROC Decomposed (Ranked by TW 2014)
Decomposing the ROC into numerator and denominator (Chart 7 below) yields some interesting insights into which countries are the most capital intensive in aggregate wealth dollars and the sheer difference in scale (both charts are in log scale) with the US harnessing $314 trillion in wealth vs. Germany, France and the UK at only a fifth of the size.
Chart 7 – ROC Per Capita Decomposed (Ranked by TW Per Capita 2014)
On a per capita basis, the two components of ROC make more intuitive sense (almost like a company’s book value per shareholder). Here the differential between the US & Canada is marginal (both roughly $1 million in wealth per person). The top 20 rank on total wealth per capita is however made up predominantly by rich European, Asian and GCC countries – not at all surprising, especially due to the relatively small populations for many of them. What does become clearer is how low the ANNI is relative to TW for the GCC countries (red bars) all earning very low incomes relative to their enormous wealth – a confirmation of poor productivity reflected in the bottom decile ROC rankings. Turkey, Greece, Spain and Italy all appear to have generated outsized ANNI relative to their capital base – further explaining their high ROCs.
Chart 8 – ROC Per Capita Growth (1995-2014) – Ranked by TW Per Capita Growth
Now overlay this with growth trends (Chart 8 above) and the narrative begins to become even clearer – countries that are growing their ANNI at a higher rate than growth in their deployed capital (e.g. Romania, Turkey, Brazil, China, Vietnam, Nigeria and even Ukraine) are showing positive trends in successively higher ROCs since 1995 (Chart 9 below illustrates this on a sequential country-by-country basis). The laggards, with deteriorating ROC trends, include countries like Chile, Bangladesh, Thailand, Morocco and Saudi Arabia.
Chart 9 – ROC Trends by Country (1995-2014) – Top 25 & Bottom 20
Now on to the important aspect of capital allocation. The 2014 snapshot composition of total wealth by country is quite interesting (Chart 10 below, we ranked countries by share of human capital which tends to be the dominant capital class for successful models). This highlights how capital is being allocated by each country and may provide some hints as to why their ROCs are high or low (we assume produced capital or human capital, on balance, should earn a superior return to natural assets).
Of note are the countries that lead in share of produced capital (Greece, Turkey, Italy, Romania, Ukraine) versus those that top the ranks in terms of share of natural capital (Iraq, Kuwait, Saudi Arabia, Mozambique, Tanzania and Ethiopia). Finally, the net foreign asset (‘NFA’) share is also telling, highlighting those countries that aggressively financed their growth (Turkey, Mozambique, Greece, Tunisia, Jordan, and top-ranked Lebanon). Surplus NFA countries with large shares of wealth are not surprising – Singapore, UAE, Kuwait, Saudi Arabia, Norway & Switzerland) – all are countries with substantial sovereign wealth funds that deploy excess capital actively in offshore global markets.
Chart 10 – Composition of Wealth (2014) – Ranked by Share of Human CapitalChart 11 – Composition of Wealth (2014) – By Region
How have these shares of wealth evolved in the past two decades and what shifts are discernible? Chart 12 below shows the 19-year (1995 to 2014) delta in share of wealth capital by country (ranked by the delta in human capital). Those countries deploying away from natural capital and into human and produced capital include: Nigeria, Ethiopia, Ghana, Tanzania, Sri Lanka and even Jordan. Those countries who are deploying in the opposite manner (away from human and productive, into natural) populate the bottom half of the chart – Iraq, Kuwait, Morocco, Saudi Arabia, Oman, UAE.
What is especially noteworthy is that the GCC countries in this sample are also allocating aggressively away from produced capital (along with Kazakhstan and Russia). This shifting asset mix into less productive capital classes goes a long way to explaining why their ROCs are not only very low, but continue to deteriorate.
Chart 12 – Delta of Share of Wealth (2014) – Ranked by Delta in Human Capital Share
For those countries with a disproportionate weight (say > 35%) of their wealth in natural capital (Chart 13 below), they are distributed roughly evenly by those with a) large endowments of hydrocarbons (GCC, Iraq, Kazakhstan), b) those with large endowments of agricultural land (Madagascar, Mozambique, Tanzania, Uganda, Cote d’Ivoire) and c) those with large mineral deposits (DRC, Zimbabwe, Peru and Chile).
Chart 13 – Composition of Natural Capital Wealth (2014)
Finally, zooming in on the last decade of ROC performance (2005/7-2014/17), and looking at per capita ANNI growth vs. per capita wealth growth, one can see the quadrants of outperformance and underperformance more clearly. Countries below the curve are growing their wealth capital at a higher growth rate vs. their income (above the line the opposite). If one were to draw an analogy here to EPS growth (ANNI PC growth) and Asset growth (TW PC growth), it becomes all too evident which countries are debasing their capital versus those that are sweating their assets most. South Asia countries (for the most part) as well as most East Asian developing countries lead the rankings here, with the likes of India, Indonesia, Vietnam and Bangladesh firmly in the high growth/high EVA quadrant. Meanwhile on the opposite side of the spectrum, the GCC, Russia, the majority of developed Europe, South Africa and Nigeria are printing low income growth (highly negative in real terms for many) whilst debasing their per capita wealth.
Chart 14 – ANNI Per Capita Growth vs. TW Per Capita Growth (last 10 Years)
So that is the holistic national ROC perspective. We find this a very useful construct to identify the countries that have structural strengths or weaknesses in how they treat their citizens’ equity, whether because of disappointing growth models on the income side or because of chronic misallocation of national capital.
However, if the country’s capital markets represent only a slither of this national wealth profile, it is obviously important to look at the market level dynamics through the lens of the stock markets in order to assess this cross-section of the real economy. Many will argue that stock markets represent the purest form of ‘negative selection’ in that companies that choose to list, invariably are serial, net-consumers of capital (implying that they are not able to generate sufficient capital internally from free cash flows or through senior classes of capital – e.g. debt) which in turn forces them to list and dilute their equity ownership. While we agree this may be true for some franchises, we also believe that stock markets also offer a unique avenue for high-growth and moderately capital-intensive companies to fund their growth when they are smaller, less known/credit-worthy and thus unable to attract debt financing. Equity market listing also enables companies to better institutionalize their governance and ownership and is also generally a very positive public-relations booster for consumer-facing companies.
We mention this point so that one keeps a proper perspective when evaluating a country’s stock market dynamics relative to the national profile, especially since stock markets across the developing world tend to be quite narrow in breadth. If a country’s stock market is dominated by highly capital-intensive, serial capital issuers that do not grow, invariably the country’s market returns will look far inferior to that of the real economy and vice versa.
The next set of charts draw the picture out for stock markets in detail based on current and historical aggregate equity market data. We defaulted to use MSCI indexes for each country (when available) and used domestic market indexes when not. All indexes are market capitalization weighted in their construct.
Chart 15 – Stock Market Returns on Capital Ranking
Chart 15 above ranks markets based on return on equity (ROE) and return on assets (ROA). When contrasting the stock market ROC ranking with the national ROC ranking, several things become apparent. First, quite a few of the top decile countries on the national ranking do not make the cut for the market ranking (e.g. Turkey, Lebanon, Greece, Egypt and many others). One of the reasons is likely the representation issue (stock market index only represents a small fraction of the total economy). This is especially the case for the likes of Egypt, Greece, Sri Lanka, Kenya and Lebanon where less than a handful of stocks constitute the super-majority of a market’s capitalization-weighted index (e.g. CIB in Egypt and Safaricom in Kenya with weights north of 25%). The second reason is the skew of the mix of capital being deployed for each. Turkey is a good example in this case, since the stock market is quite broad and somewhat representative of the economy (MC/GDP of close to 30%), but since the ROC for stocks is materially lower than that for the overall country, it therefore suggests that non-listed franchises may be dramatically more leveraged (high negative NFA) or simply because they are far more productive with the capital they employ than listed names (high produced capital).
On the flip side of the rankings (lower deciles) the consistency of poor ROCs across both stock markets and economies lies mainly with resource intensive countries (e.g. GCC, Russia, Zimbabwe) suggesting that market representation is less of an issue for these countries (Russia MC/GDP is 45%, while all GCC countries excluding Oman are well north of 50%, with some like Saudi Arabia post the 2019 Aramco IPO now at >220%). Here the consistency of lower decile returns for both market and nation is most likely due to the highly tilted weight of deployed capital in low return natural assets and a high dependency on resource rents that lubricates and drives growth even in non-resource sectors of the economies (e.g. banks, consumer spending, government spending, construction, etc.).
Chart 16 – Stock Markets: Returns on Capital & Earnings Per Share Growth (10 Years)
Chart 16 above plots countries on a similar matrix that we used to look at country ROC profiles (Chart 14 above) where the analog between Earnings Per Share and ANNI per capita is made and where the delta in wealth per unit for the country (TW per capita) is represented by the market ROE (a proxy for Book Value per shareholder in a company). Here the consistency across both planes is much more evident – South Asian countries cluster in the top right quadrants in both (high income growers, high wealth generators). There is also quite a bit of consistency in the bottom left quadrant (low growers, debasers of wealth), with the majority of MENA countries sitting in this quadrant.
Finally, a quick look at stock market valuations (Chart 17 above and 18 below). This is useful to gauge how stock market ratings reflect their respective dynamics and if there are dislocations between reality and perception. While static snapshots are somewhat useful in benchmarking relative valuations, we tend to give much more weight to longer horizon metrics (10 years) which tend to smooth out cyclicality and bouts of euphoria and panic from ratings.
Chart 18 illustrates this nicely, with trailing 10-year average ROE plotted against current Price to Book Value. Markets above the line are over-rated relative to long-run historical ROE, while those below the line are under-rated (all else equal). Here we tend to focus on markets that are highly dislocated relative to their long-run EVA track record, and are particularly interested in those with strong structural country ROC profiles (e.g. Bangladesh, Nigeria and Egypt – to name only a few).
Chart 18 – Stock Markets Valuation: Trailing ROE & Price to Book Value (April 2020)
In a relatively short period (the last 10 years), Ukraine has begun to make its mark in the top rankings of major poultry exporters. The country, historically known as the ‘breadbasket of Europe’, with over a quarter of the world’s fertile chernozem soil (or “black earth”) and 54% of its land arable, has long dominated several grain and oil-seed export markets (4th ranked wheat exporter globally, 3rd ranked exporter of corn, top-ranked exporter of sunflower oil).
In recent years the country has made tremendous strides in transforming this natural comparative advantage in agriculture into a value-added export through scaled production and export of poultry (the most consumed meat protein globally by volume and the most affordable for emerging consumers climbing up the food ladder; chicken costs 30% of the cost of beef, less than half the cost of pork).
Ukraine has grown to become the world’s 6th largest exporter of chicken (5th ranked net exporter) with an expected 3.4% share of global exports in 2020 (USDA forecast). What is most impressive is that the country has grown its exports at 21.5% CAGR since 2013, far outpacing any of its top export rivals, and has done so in spite of a relatively stable Hryvnia (unlike the Brazilian Real, the UAH/$ was one of the best performing currencies in 2019).
With big logistical advantages vs. Brazil (the world’s dominant exporter of protein) for exports to two of the fastest growing regional markets for protein (MENA and SSA), a shrinking domestic population with a high consumption penetration for chicken, abundant water & land resources and favorable climate, and with land reforms expected to unlock further supply of underutilized farmlands, the country is well positioned to continue to grow its export market share in the next decade and beyond.
Looking at the sources and consumers of food by country from ’40k feet’, it is clear where the scalable and sustainable food supply will come from and where it is needed most.
The first chart below segments countries by the ratio of the value of food & meat exports per capita relative to imports per capita (data from UNCTAD; size of each country bubble is the total size of the value of food trade (in US$s), the heat map corresponds to the intensity of the ratio of exports/imports – red=low exports/imports, green=high exports/imports).
The second chart below takes the two extreme clusters (‘structural food importers’ and ‘structural food exporters’) and looks at their past decade respective growth in population and food production (World Bank data).
Countries such as Ukraine, Thailand, Brazil, Peru and Argentina really stand out on the net exporter side as they are large net exporters of food and are growing their food production at a higher rate than their population growth, thus being able to scale exports to meet the growing need of importers across the globe. On the flip side (structural importers of size), those that are big net food importers and where population growth far exceeds domestic production of food, include countries such as Qatar, Iraq, Venezuela and Saudi Arabia – mostly large MENA countries with structural food deficits. It is noteworthy here that some importing countries (Bangladesh and Algeria notably) have managed to successfully increase food production at a higher rate than population growth, thus tempering import growth. Bangladesh’s achievement in this regard is especially impressive in light of how little arable land the country has and the sheer size of its population. Necessity in the mother of innovation as Bangladesh will likely remain a large structural net importer of food in years to come (note where it is positioned in the first chart).
The ‘haves’ and the ‘have nots’ of #foodsecurity can also be classified by abundance (or scarcity) of the two essential inputs to farming and crop cultivation – arable land and renewable water resources. You either have them or you don’t .
If we look at these vital resources in terms of per capita endowments, then the classification becomes abundantly clear. Here again, MENA countries (red) cluster almost exclusively in the ‘short’ quadrant (with the lone exception of Iran), while the ‘abundance’ quadrant is populated by the same large structural food exporters we highlighted in Part I (see: https://lnkd.in/dAwfXet).
While land productivity is something that can be maximized (farming yields or production of cereals per hectare of arable land), renewable water resources can also be utilized more productively, efficiently and sustainably (modern irrigation). There is however a limit to productivity, uplift with cereal yields in many MENA countries having reached levels that have eclipsed the likes of Brazil & Argentina already (two of the most productive farming powerhouses globally). Can MENA farming productivity rise much further to satisfy growing domestic demand?
We believe this further underscores the severity of MENA’s food scarcity situation.
Looking at the cross section of food consumption & production trends with global food trade reveals some interesting insights, particularly for the MENA region.
1. MENA countries dominate the list of top per capita wheat consumers globally (11 of the top 20), with several still growing consumption at far higher rates than the world average. Egypt is the world’s biggest net importer of wheat (aggregate tons of 12mil expected in 2020 by the USDA vs. 3.3mil for China), while KSA (the country turned from a modest exporter to a large net importer in the last decade) is the fastest growing wheat importer globally (since 2007). We believe accelerating water shortages and non-competitive feed costs (after subsidies were removed) are likely driving this dynamic.
2. MENA countries are also big meat eaters per capita and in the past decade have become some of the fastest growing importers of meat globally (4 of the top 10 include Iraq, KSA, UAE and Egypt).
3. Per capita food production trends are falling for most MENA countries (indexed to 2004/6), some dropping precipitously: Lebanon, Iraq, KSA and Jordan, while the Maghreb countries for themes part have managed to keep production rates stable – mainly by maintaining yields through the productivity lever.
4. Production shortfalls relative to fast growing consumption has however led to world-beating import growth with 8 of the top 20 net per capita food importers globally are MENA countries, while only one (Turkey) remains a net exporter of food (particularly protein). Eight of the top 30 biggest net importers of food per capita are MENA countries (UAE #2 behind first ranked Hong Kong, KSA #6 ahead of the UK).
5. Overlay onto this scary picture the fact that MENA countries overwhelmingly dominate the world in prevalence of obesity (12 of the top 20) with only the likes of Sudan and Yemen printing obesity prevalence rates at or below the world average of 13%.
How much of the high and growing consumption is a function of waste, overconsumption or merely the negative consequence of the ‘curse of plenty’ (subsidies and by extension fiscal largesse due to high oil prices of the past decade)? Shouldn’t at least part of this chronic food import dependency be addressed by moderating excessive, unhealthy and wasteful demand?
Here is a dangerous cocktail: a) chronic dependency on either foreign aid, inbound remittances or resource rents (or all of the above) and b) a dangerously overvalued exchange rate that is (in most cases) artificially pegged to the all-mighty, yet inflated US dollar.
One of the not-so-obvious consequences of this toxic brew is an acceleration in capital flight or ‘offshoring’ of deposits (in terms of both aggregate stock of offshore deposits & their share relative to domestic deposits or GDP).
We recently came across a World Bank report on offshore deposit trends amongst high foreign aid recipient countries in the developing world (see: https://lnkd.in/deXEGmg). It is unclear to us from the report that merely a high dependency on aid in fact leads to ‘elite capture’ via ‘Haven’ offshore accounts (the causality evidence is rather weak). However, once you broaden out the variables, the empirical evidence does point to an accelerating trend in offshore deposit share for countries that have several of the above characteristics, with the common anchoring element of an overvalued exchange rate (measured in terms of REER). This is especially the case if capital is actually still able to flee unencumbered (i.e. no capital controls, financial/economic sanctions, etc.).
Several MENA & Sub-Saharan African countries stand out in this regard, with both resource rich and resource poor countries ticking too many of these boxes.
Frogs in slowly boiling water.
Note to readers: Right click chart and open in a new window for an enlarged version.
Jordan, Lebanon, Ghana & Kenya > 1.5% of GDP in Offshore DepositsAs a share of domestic deposits – Ghana, Kenya, Nigeria & Oman (all > 2%)Decent correlation at the tails (especially high corruption and high aid intensity)Offshore & Haven deposits growth rates (10 Year CAGR) highest relative to domestic deposit growth in: Vietnam, Bangladesh, Pakistan, Jordan, Oman, Saudi Arabia, UAE and NigeriaBiggest delta of share (Offshore & Haven Deposits relative to domestic deposits) are in: Pakistan, Nigeria & Bangladesh.Countries with overvalued exchange rates (REERs > 100), where capital accounts are unencumbered, tend to have higher Offshore Deposit intensity shares (relative to GDP)On resource rent intensity & aid intensity – MENA and SSA stand out.On 5 year growth – most of the chronic laggards are countries that tick more than one of the structural boxes (aid, rents, and overvalued FX)High inbound remittance intensity (% GDP) countries (top panel). Bottom panel is long-run growth in per capita income