

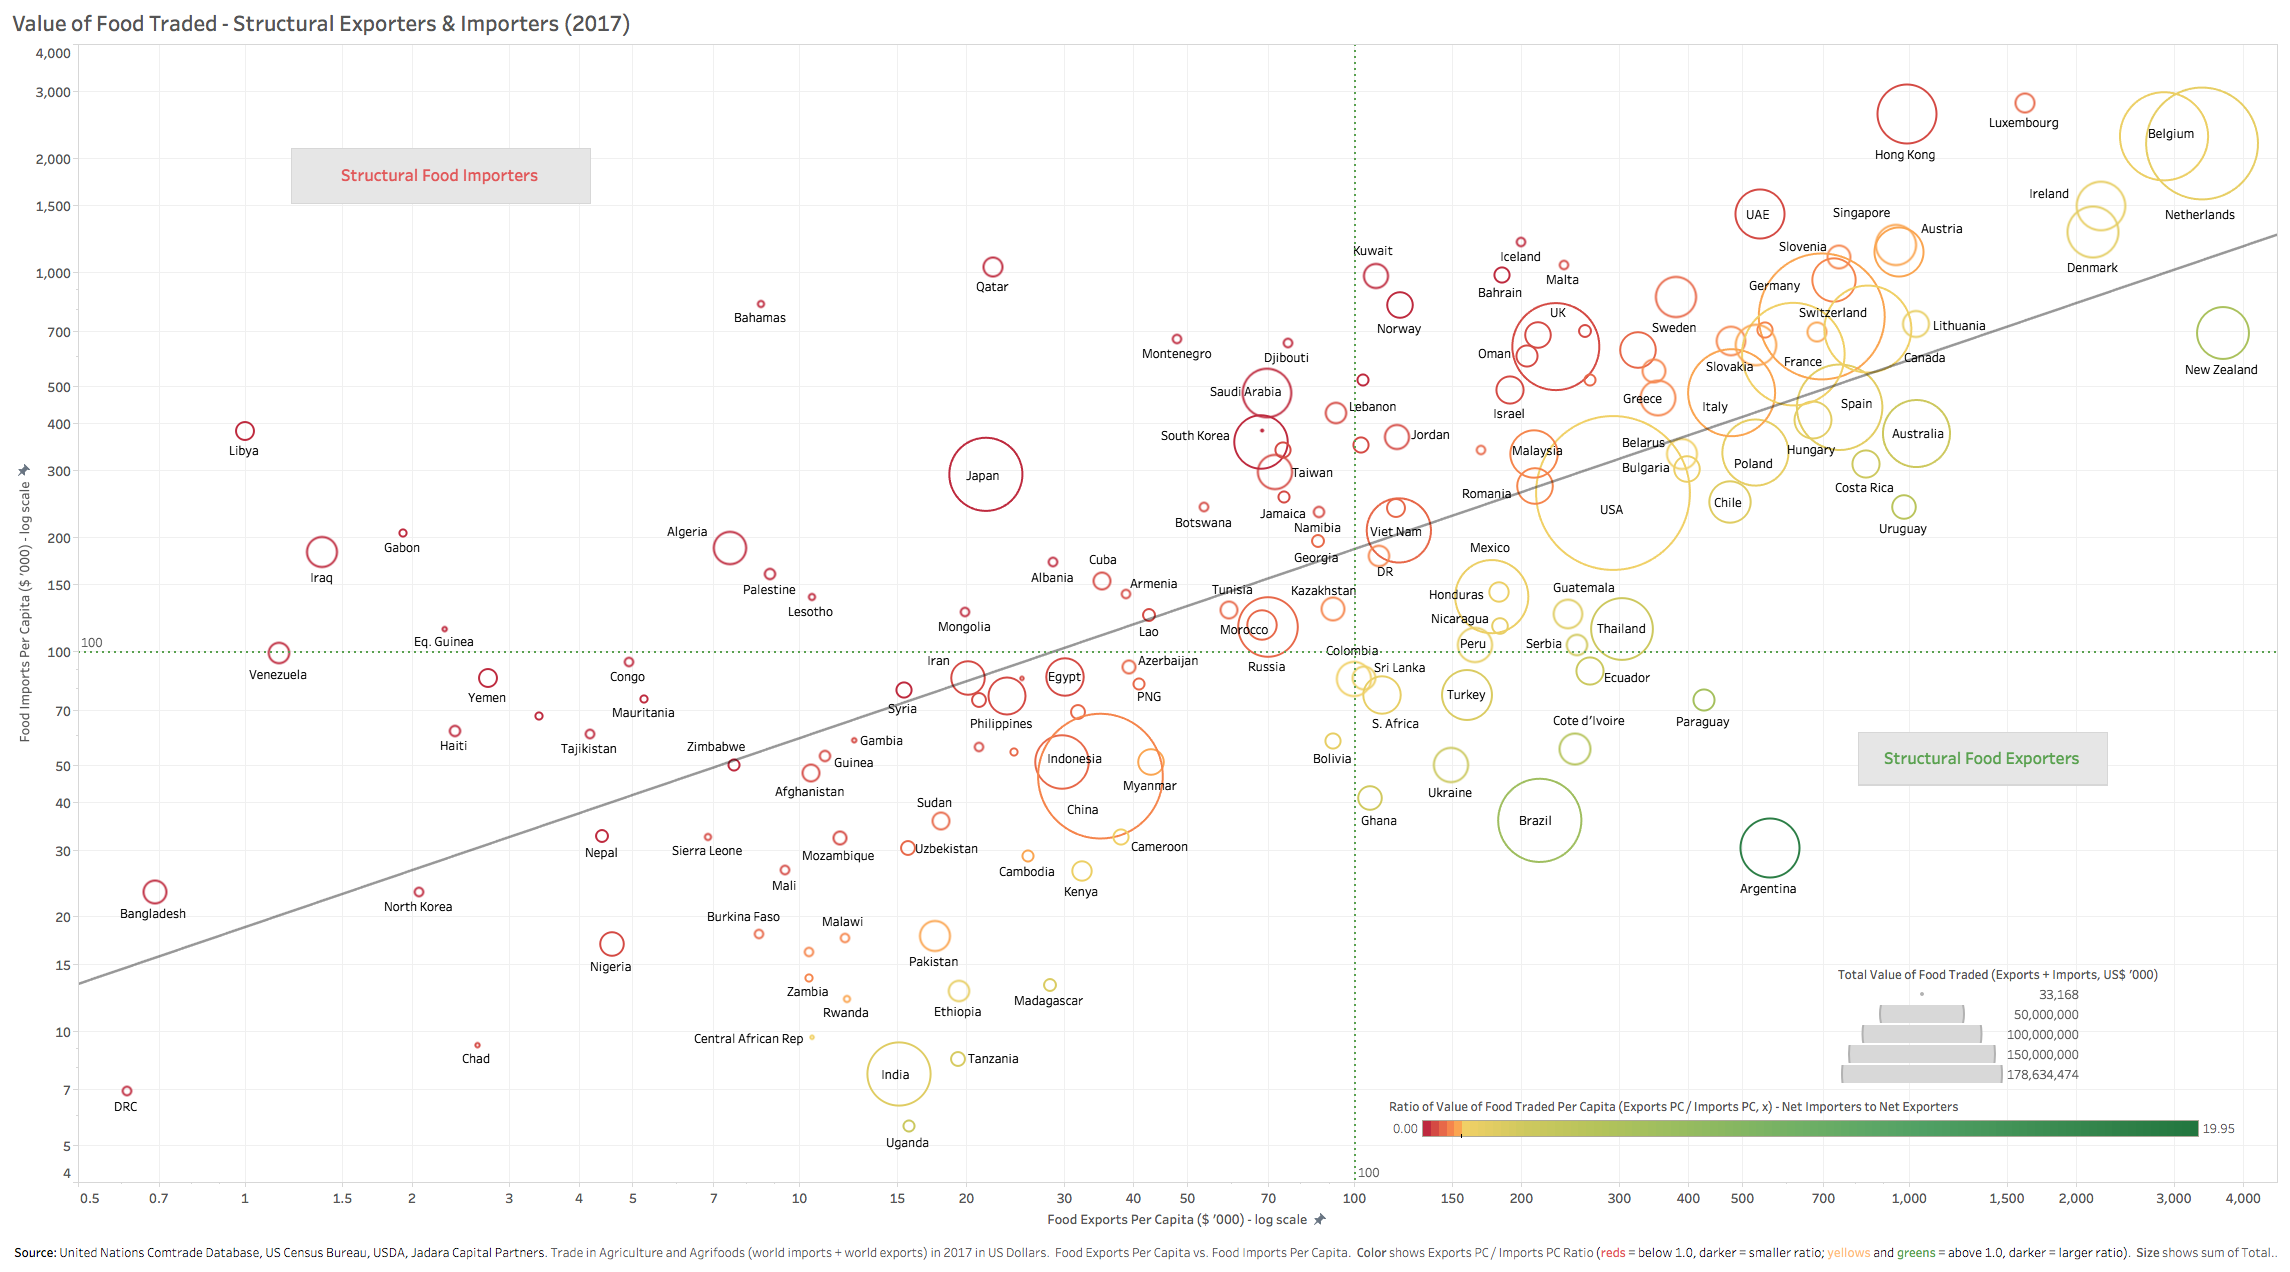
Looking at the sources and consumers of food by country from ’40k feet’, it is clear where the scalable and sustainable food supply will come from and where it is needed most.
The first chart below segments countries by the ratio of the value of food & meat exports per capita relative to imports per capita (data from UNCTAD; size of each country bubble is the total size of the value of food trade (in US$s), the heat map corresponds to the intensity of the ratio of exports/imports – red=low exports/imports, green=high exports/imports).
The second chart below takes the two extreme clusters (‘structural food importers’ and ‘structural food exporters’) and looks at their past decade respective growth in population and food production (World Bank data).
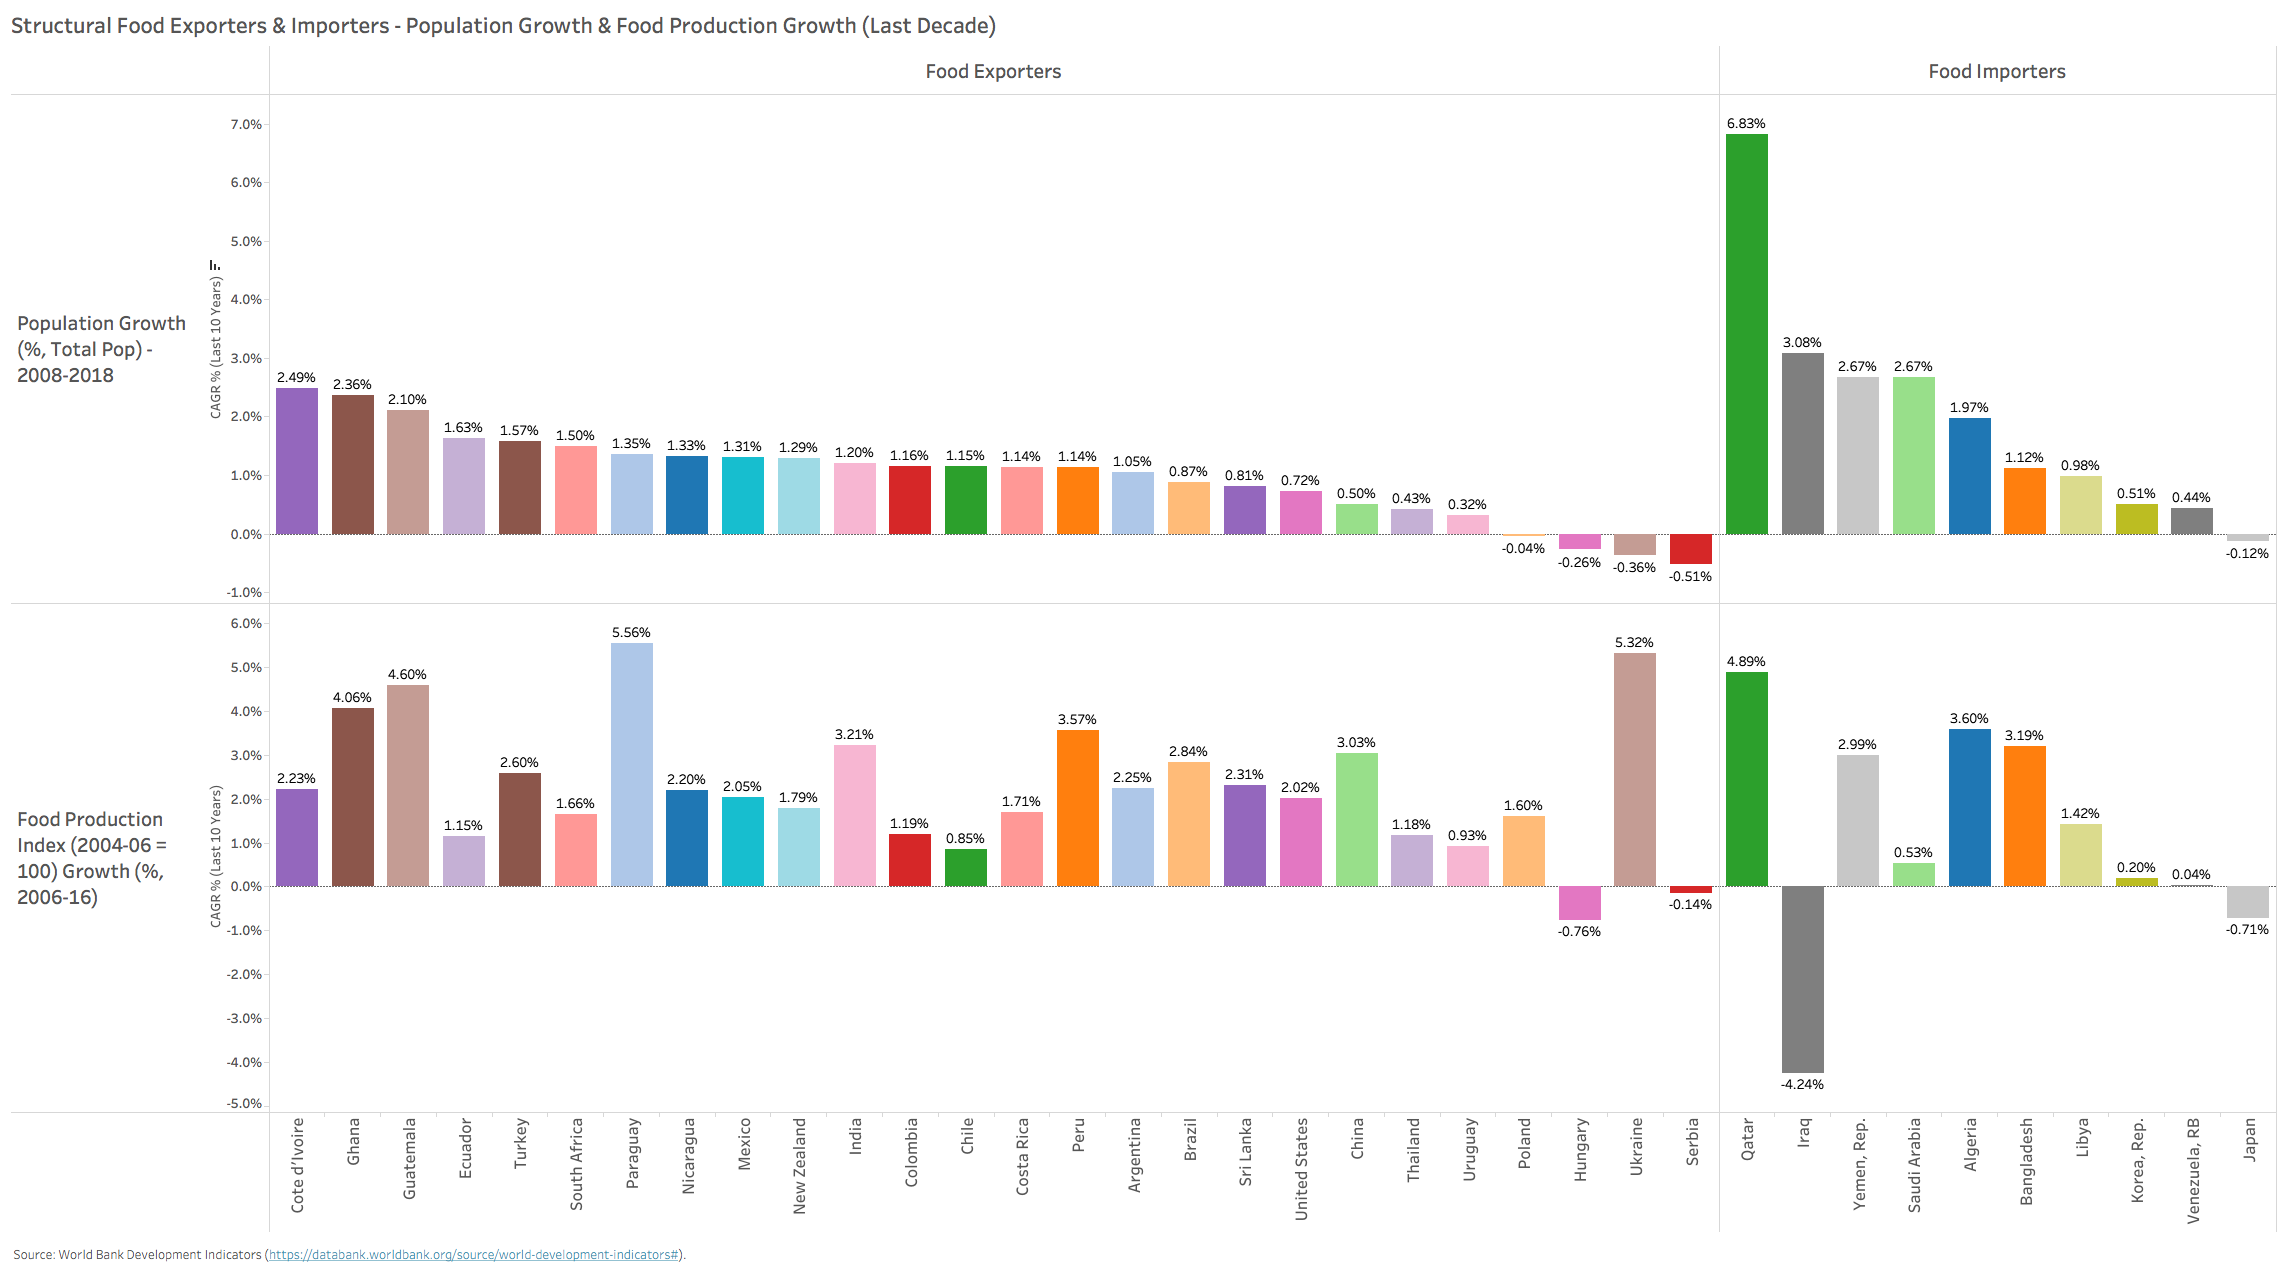

Countries such as Ukraine, Thailand, Brazil, Peru and Argentina really stand out on the net exporter side as they are large net exporters of food and are growing their food production at a higher rate than their population growth, thus being able to scale exports to meet the growing need of importers across the globe. On the flip side (structural importers of size), those that are big net food importers and where population growth far exceeds domestic production of food, include countries such as Qatar, Iraq, Venezuela and Saudi Arabia – mostly large MENA countries with structural food deficits. It is noteworthy here that some importing countries (Bangladesh and Algeria notably) have managed to successfully increase food production at a higher rate than population growth, thus tempering import growth. Bangladesh’s achievement in this regard is especially impressive in light of how little arable land the country has and the sheer size of its population. Necessity in the mother of innovation as Bangladesh will likely remain a large structural net importer of food in years to come (note where it is positioned in the first chart).
Food for thought!
