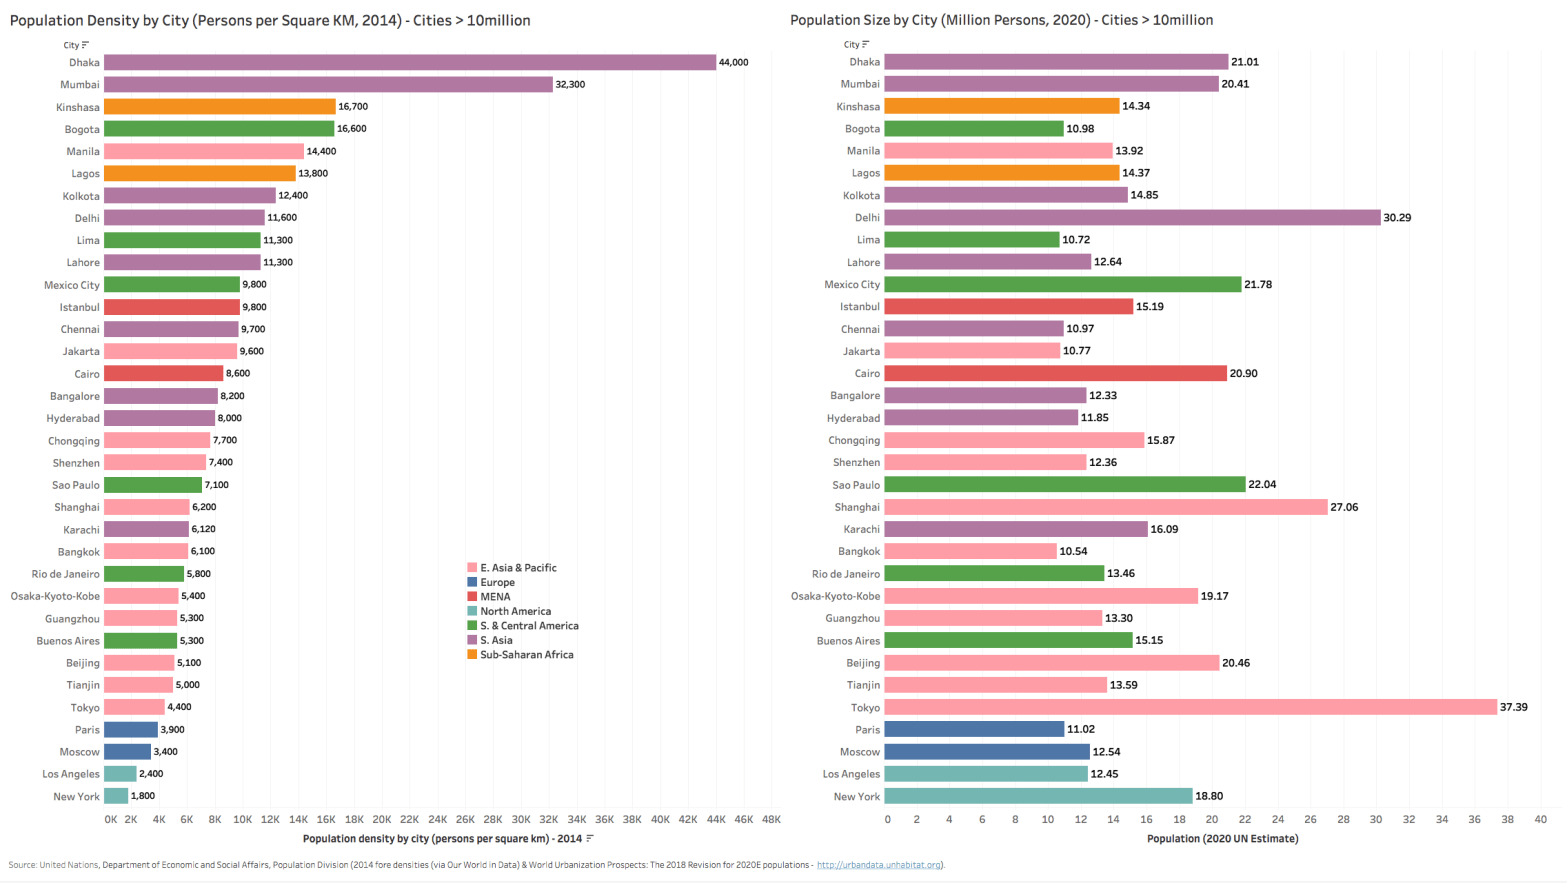
A ranking of population densities of major urban cities worldwide (UN data for city centers with populations > 7 million) sheds some light on which major cities will need to urgently address some of the challenges of contagion presented by the ongoing COVID-19 pandemic.
While most of the press focus has been mainly on developed country urban centers like New York & Paris, it is worth noting that the New York Metropolitan area (18.8 million pop, 11th largest city agglomeration) ranks only 55th globally in terms of population density of 1,800 persons/square kilometer. Densities are tricky though – since for NY, if you drill down to just the Island of Manhattan-New York (1.63 million of the total population of 18.8 million for the metropolitan area, but with only 59 sqkm of area for the Island of Manhattan vs. 34,000 sqkm for the bigger metro area), then density rises to as high as 27,544/sq km- ranking it 7th worldwide and 4th amongst large urban cities worldwide. Likewise for Paris and Los Angeles with city center densities 5.5x to 7.0x their respective metropolitan area densities.
Note to Readers: For a better viewing of charts, please right click the chart image and open as a new window to view in full resolution.

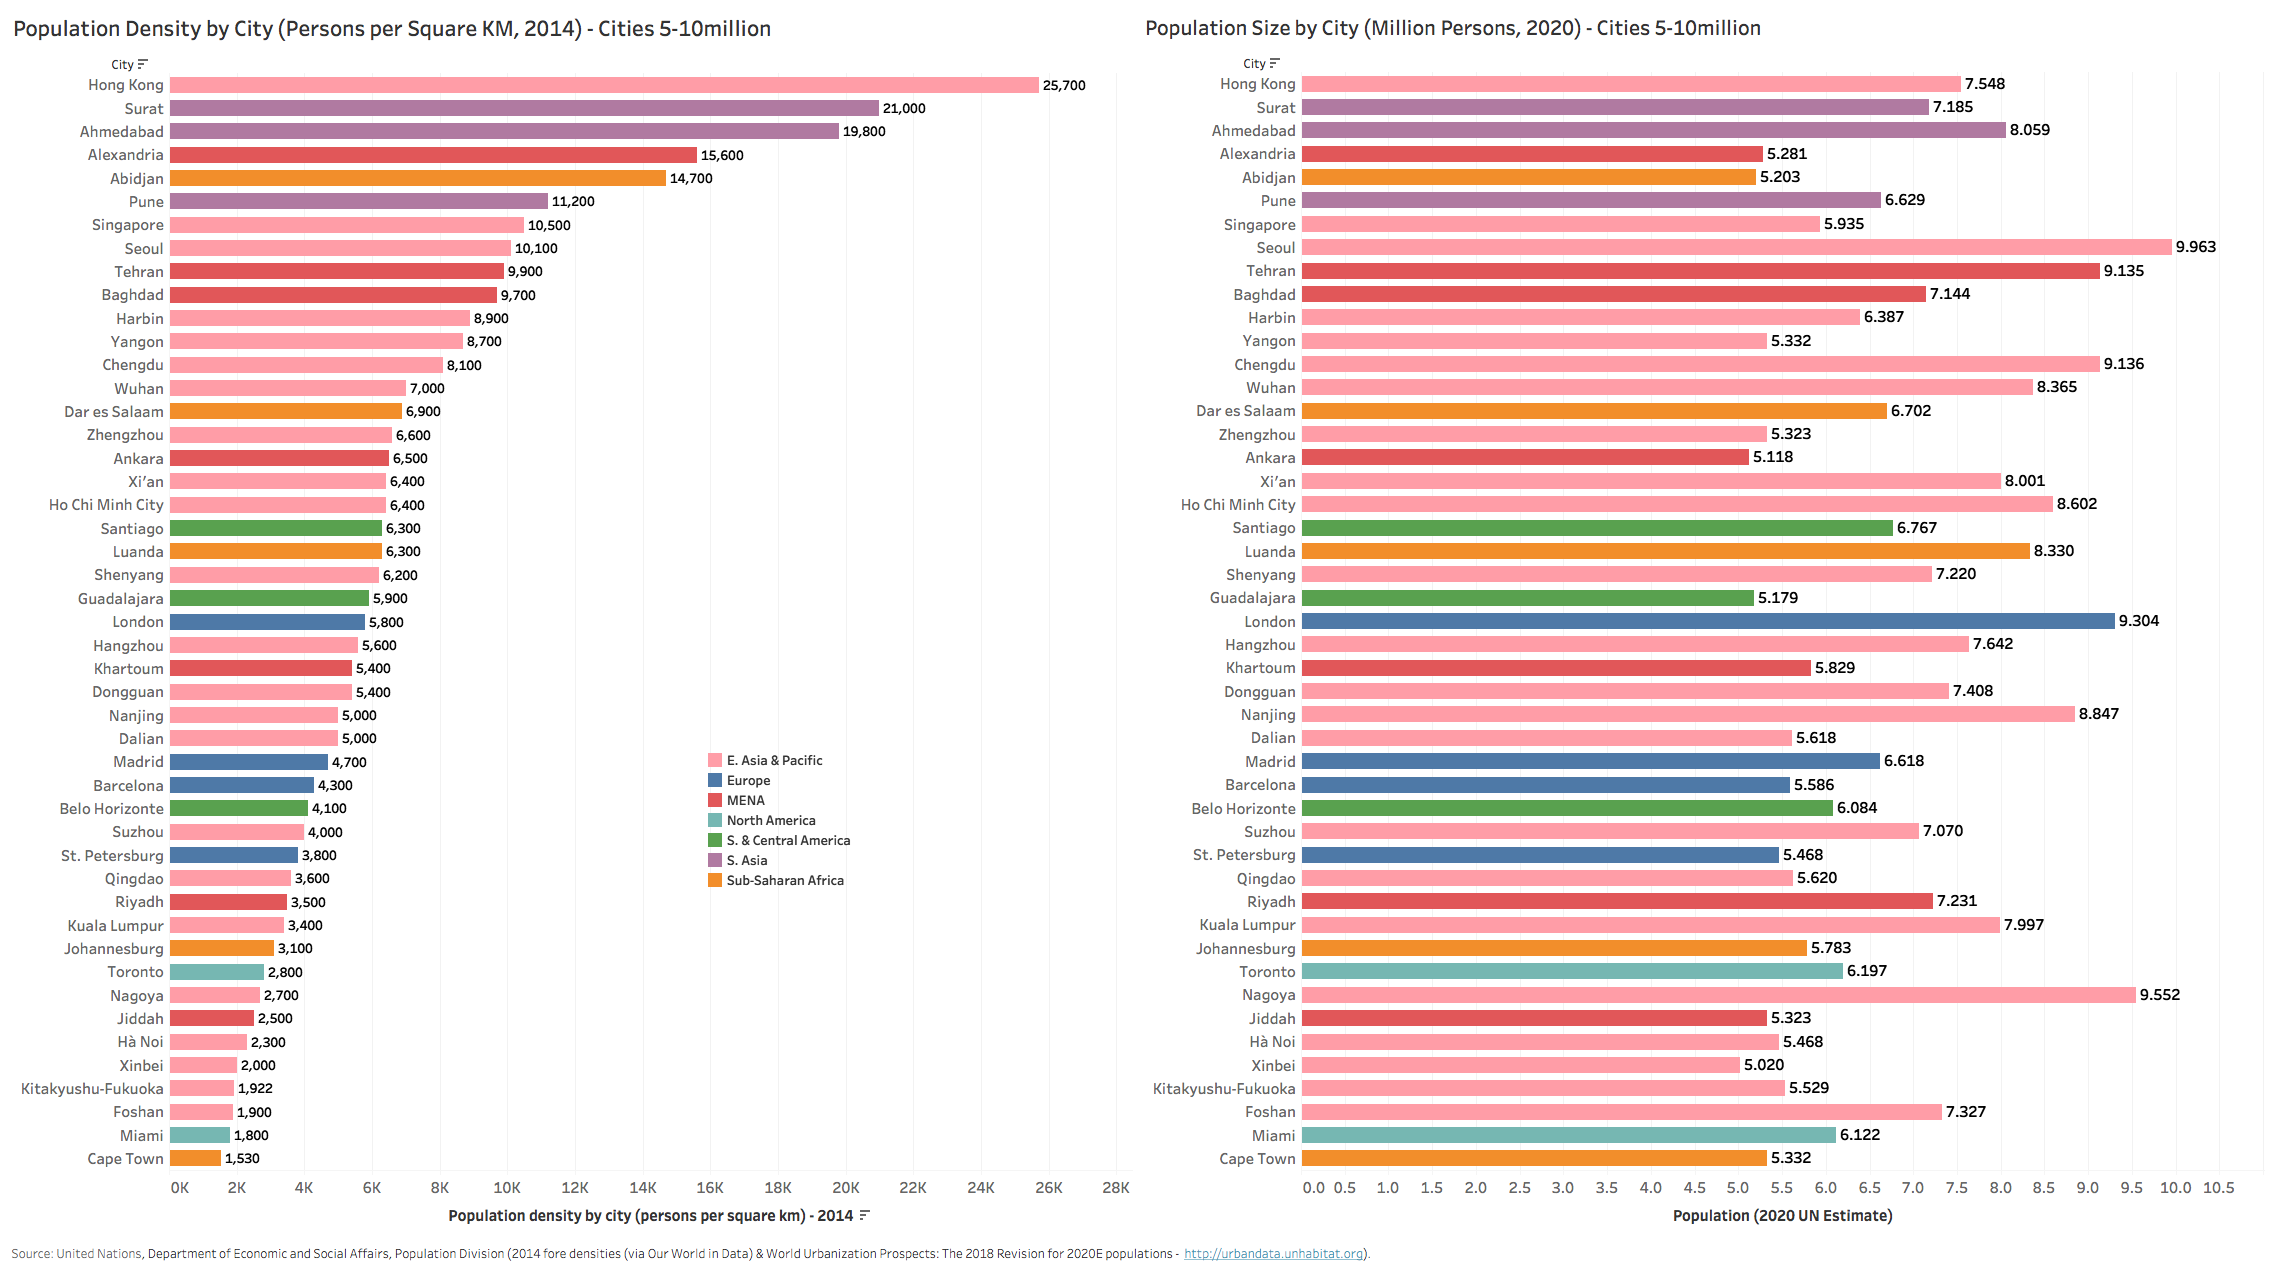

What is abundantly clear from the global city density rankings however is how prevalent high city densities are amongst developing country urban centers. South Asian and East Asian metropolitan cities make up the bulk of highly dense large urban centers, with most city densities at a factor higher than New York City. First-ranked Dhaka has a density of 44,000 and is 24x more dense than New York City (1,800), though Dhaka, with an area of just 307 sqkm, is less than half the size of NY City’s 784 sqkm of area and only 1% of NY Metropolitan area. The likes of Mumbai (600 sqkm, 32,300 density) and Dhaka are themselves quite concentrated megacities with less urban sprawl outside the central urban center – so density gaps between their metropolitan and city centers is dramatically lower. Only 8 of the top 40 most dense city centers are in the developed world, while over half (24) are in South or East Asian developing countries.
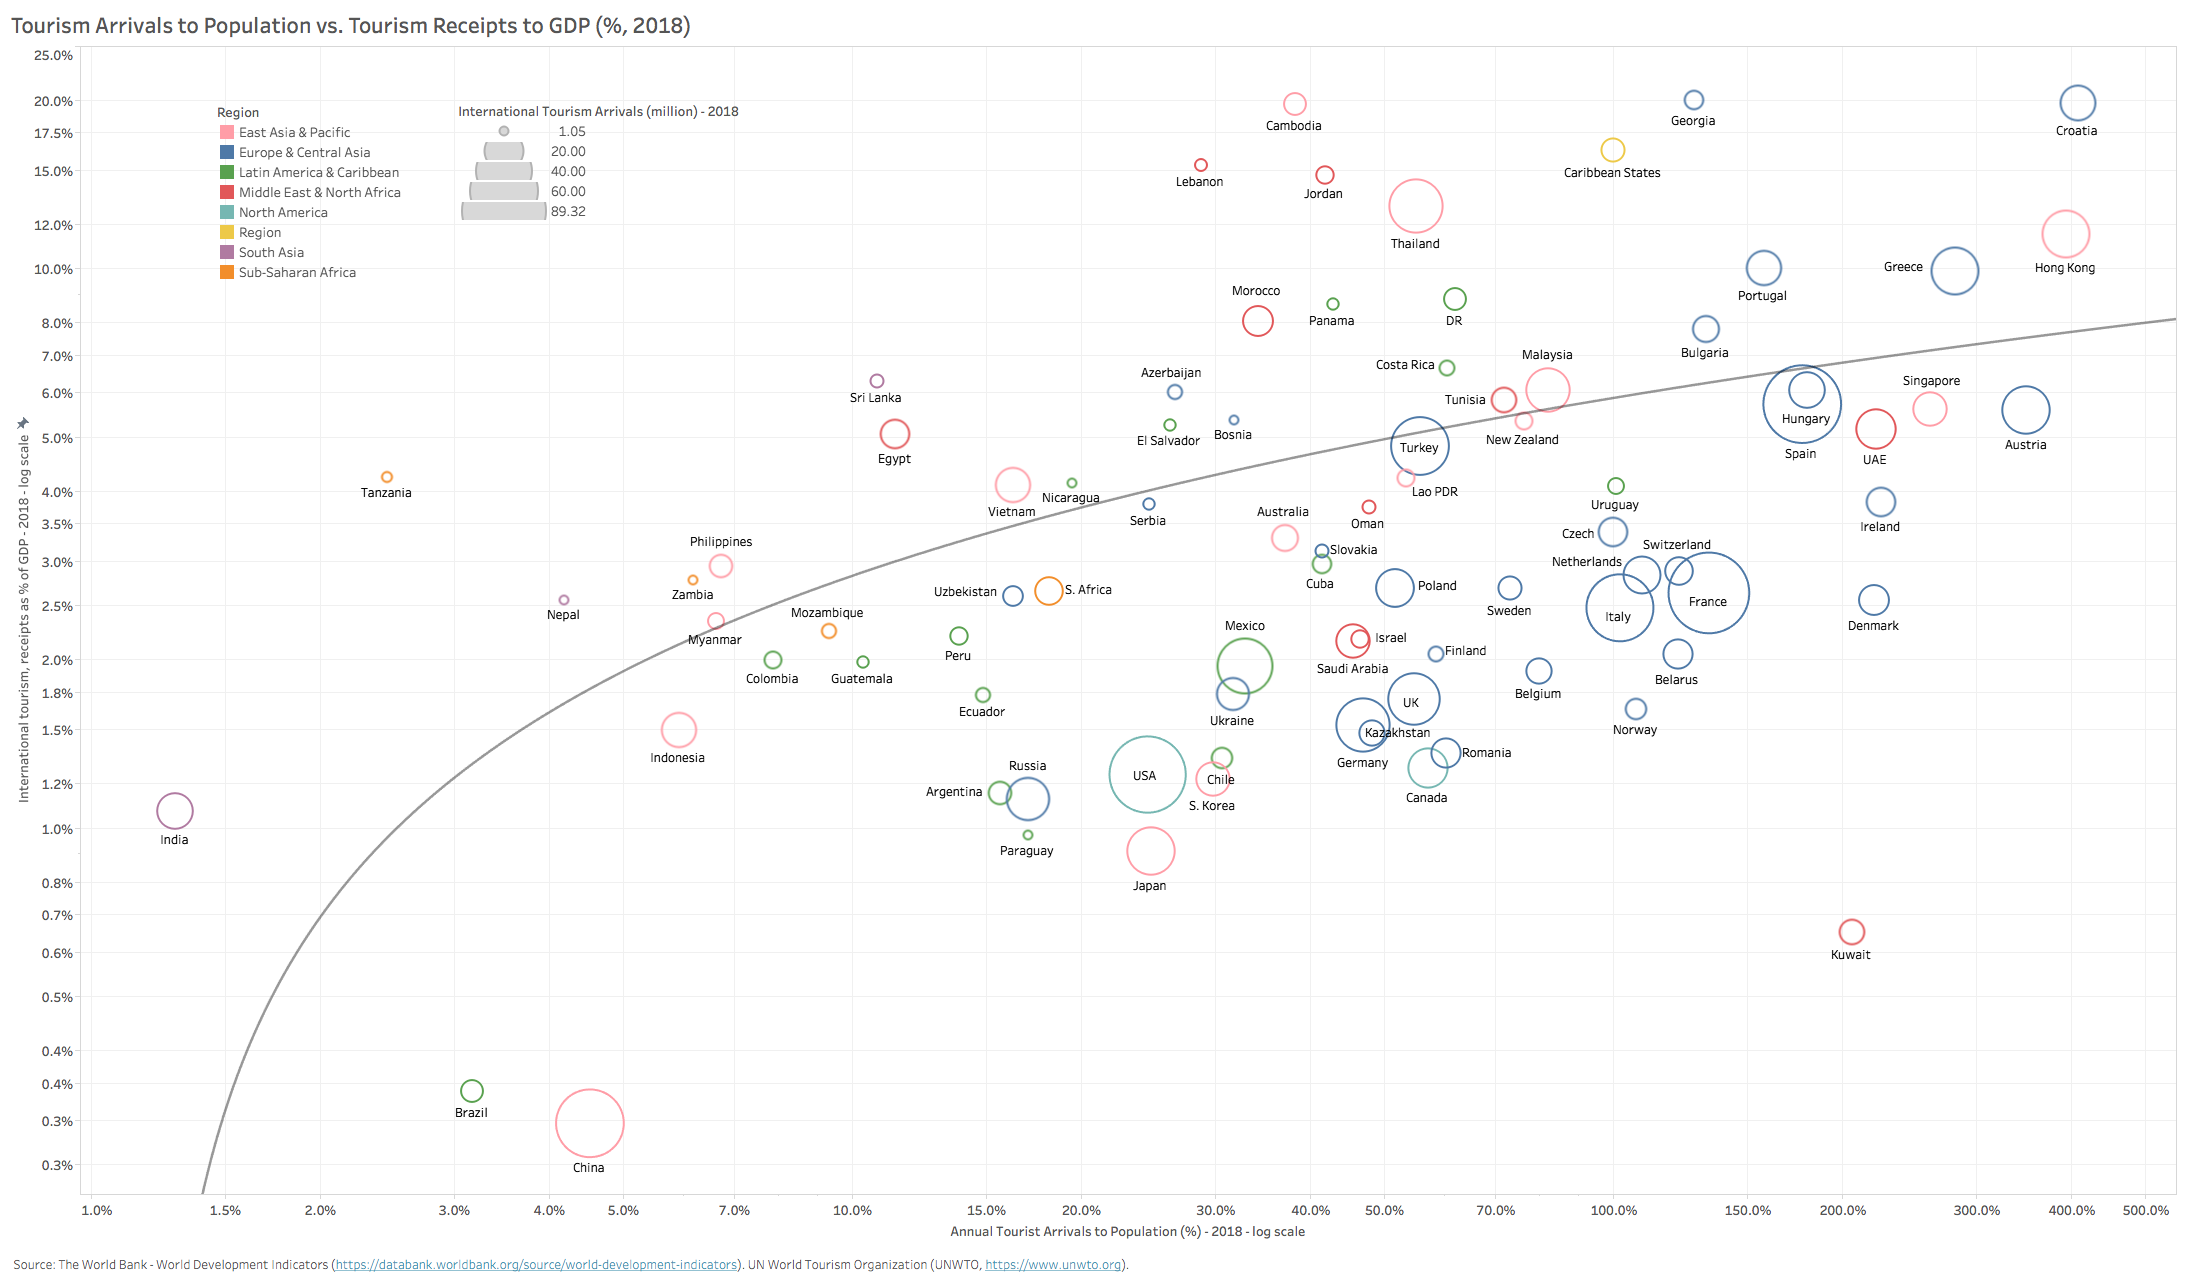
One of the factors that potentially may shield many of these emerging cities is the small size of their airport infrastructure and tourism absorption capacity. As a proxy for city-level tourism arrival traffic, we looked at national-level tourism arrivals as a percent of total population (Chart 4 above). Most developing countries have ratios well below those of developed European countries, Japan and the US (25% for the US to as high as 300% for the likes of Greece). However, those developing countries and city-states that have invested aggressively in expanding airport infrastructure capacity in the past 2-3 decades (Hong Kong, Singapore, UAE, Thailand) and countries that have a large diaspora population that visits their home countries frequently (Jordan, Morocco, Tunisia, Lebanon, Israel) – all have a high in-bound travel incidence ratio. Developing countries that are very dependent on inbound migrant workers (GCC, several of the CIS countries) are also quite exposed due to the large migrant traffic inflows. Finally, there are the small-medium developing countries that depend on tourism as their main engine for employment and growth as evidenced by a high tourism receipts/GDP ratio (Caribbean States, Georgia, Croatia, Cambodia, Jordan, Lebanon, Morocco, Portugal, Greece, Hong Kong, Thailand) – all earrings in excess of 8% of GDP from tourism while tourist arrivals as a share of local population is 50% or higher. These countries were quite exposed to the pandemic because of the high velocity of travel in the months preceding March 2020 while their economies will remain quite dependent on tourism as an engine for growth during any slow recovery period. The longer their lock-downs and travel bans stay in place, the more exposed their economies will be to severe downturns and high unemployment.
It is important to note that these are country-level proxy assessments, which like densities, may mask very high openness vulnerabilities on the urban center level. New York Metropolitan is a case in point. New York Metropolitan area airports inbounded 50.5 million international passengers in 2018 according to the Port Authority of NY & NJ (34 million into JFK alone). This is 270% of the local population, placing the New York Metropolitan area in the same exposure level as Singapore, Dubai-UAE, Ireland and Greece. One can make the same general assessment for cities like Beijing, Tokyo, Frankfurt, London, Amsterdam, Munich, Paris, Amsterdam, Istanbul, Jakarta, Los Angeles and Chicago – all of which have annual passenger arrivals well north of 60 million per annum (Chart 5 below).

Even though most of the the developed world may be more open to travel and tourism flows vs. developing countries, they are for the most part much more prepared for the pandemic in terms of health infrastructure and crisis management systems and institutions. The developing world for the most part (Russia and the FSU countries are big exceptions) have very inferior health and emergency response infrastructure (see Chart 6 below).
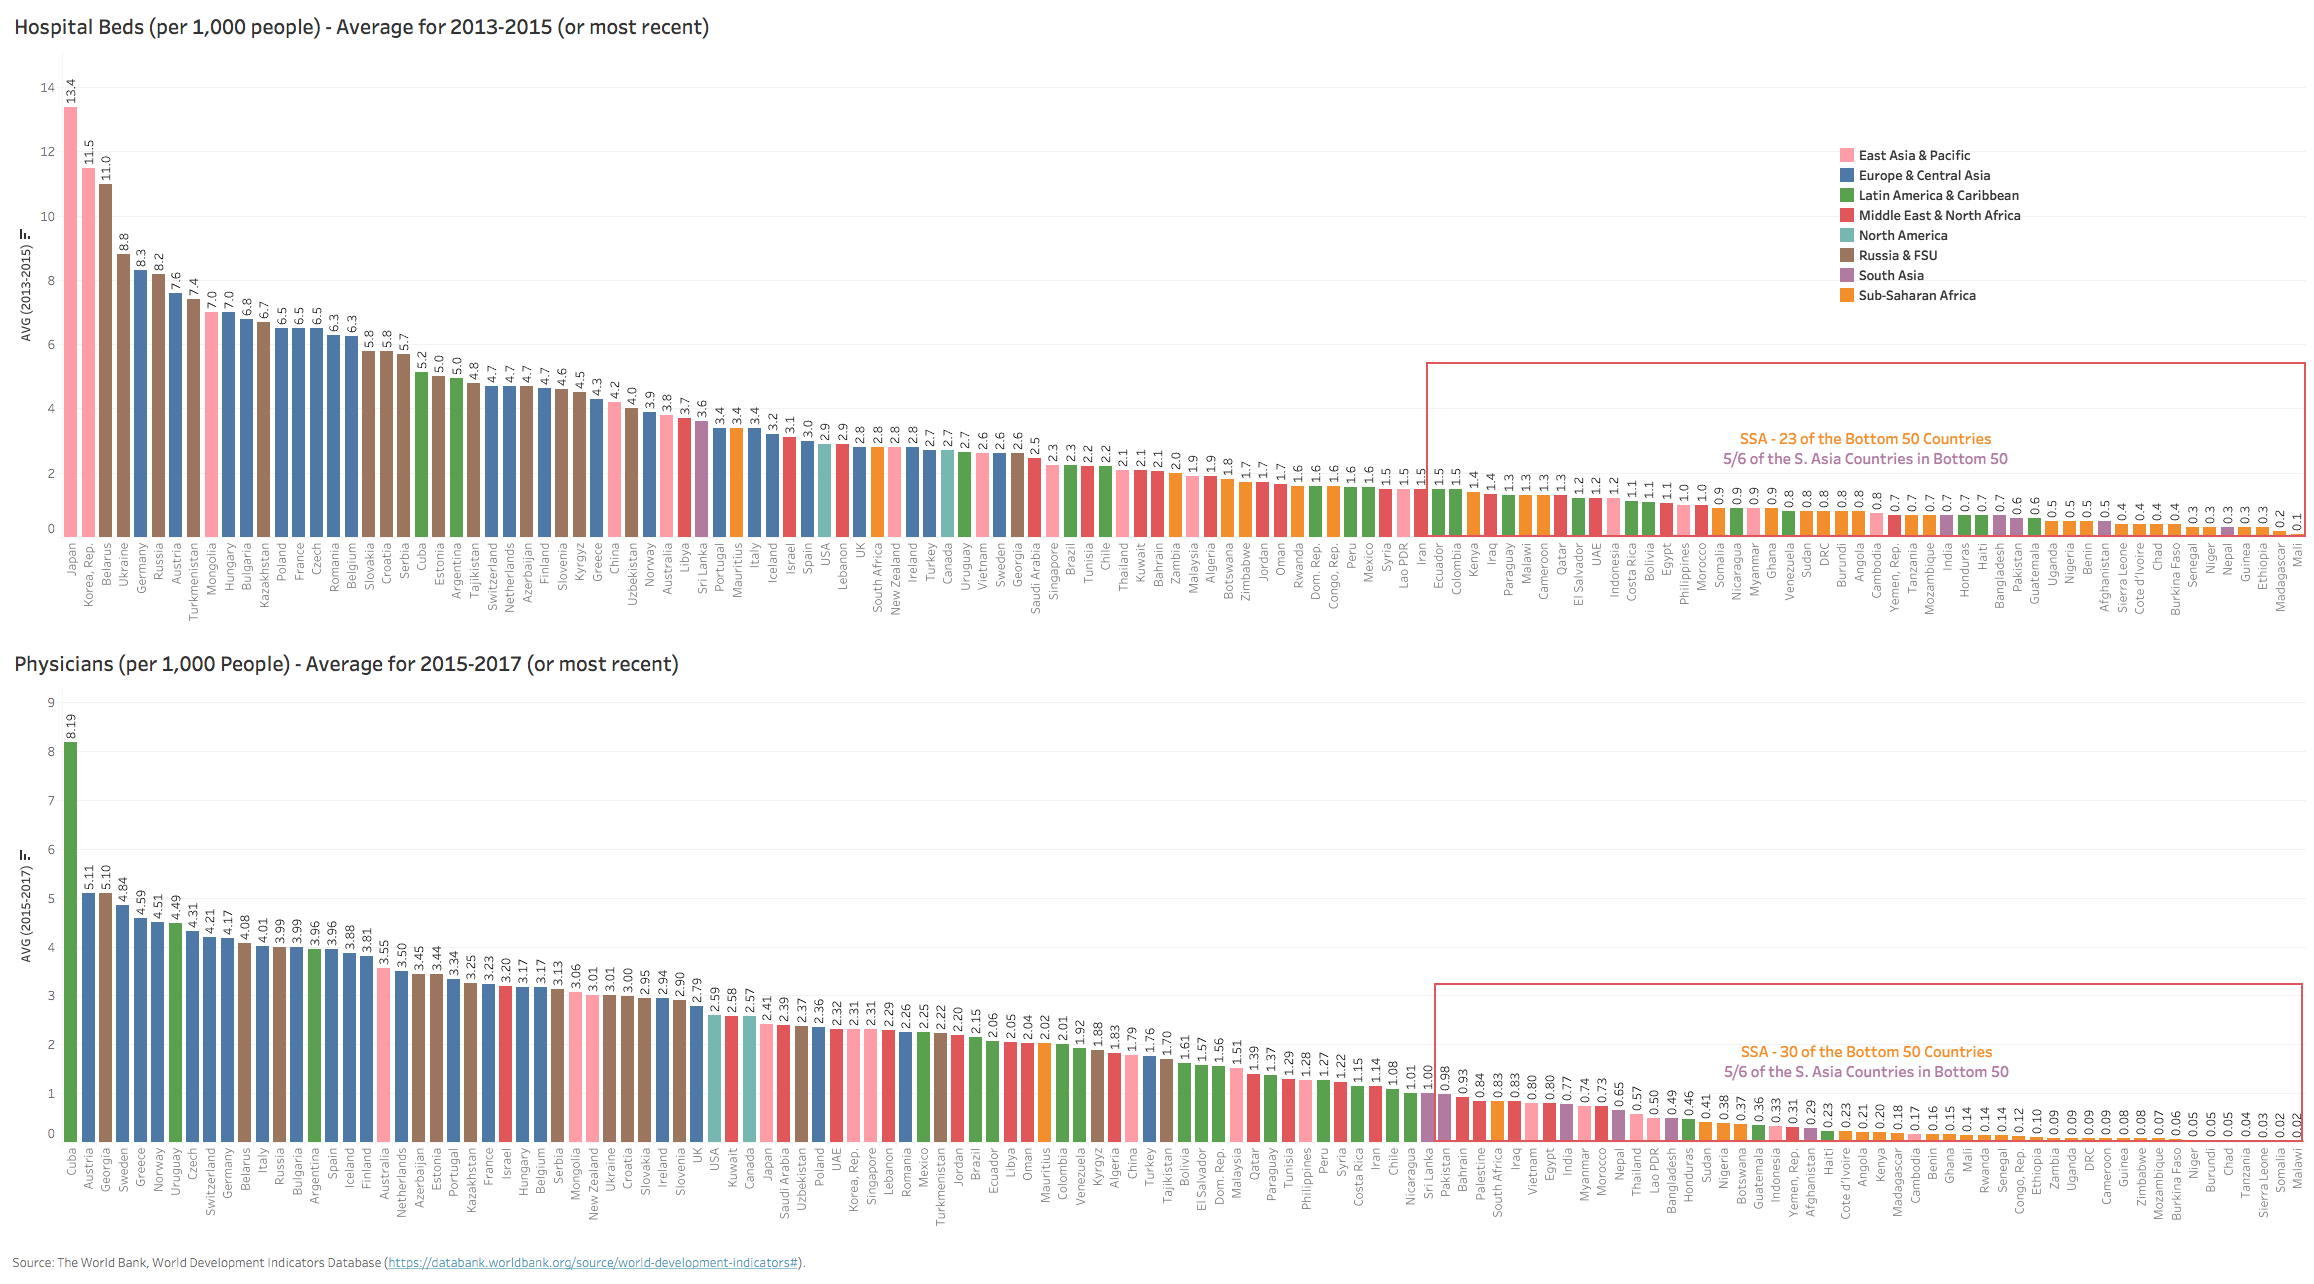
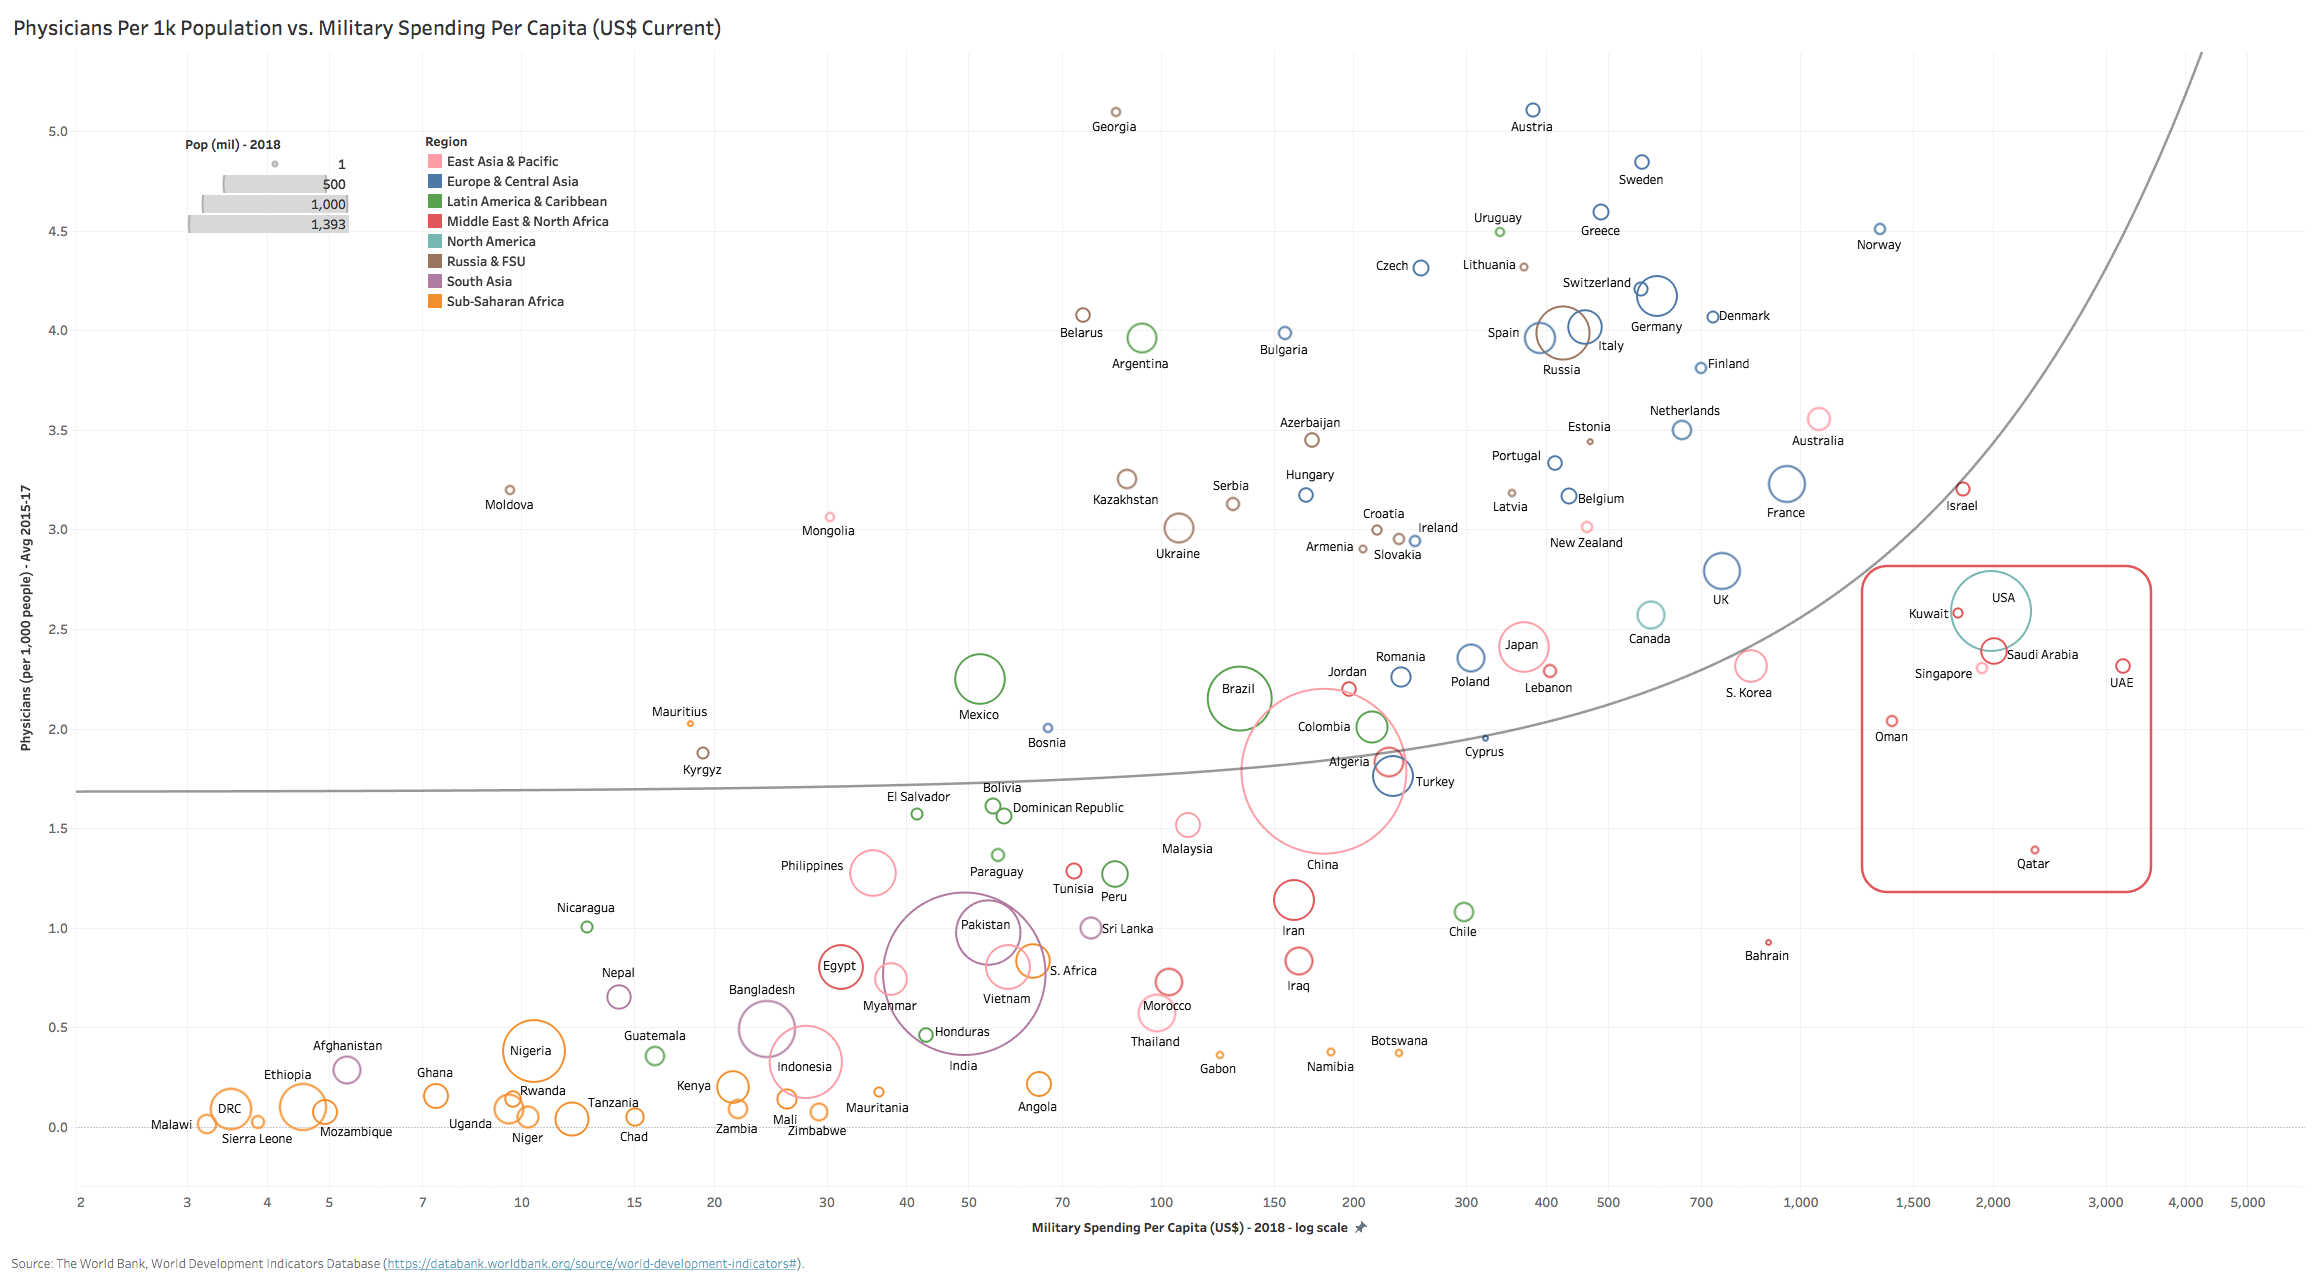
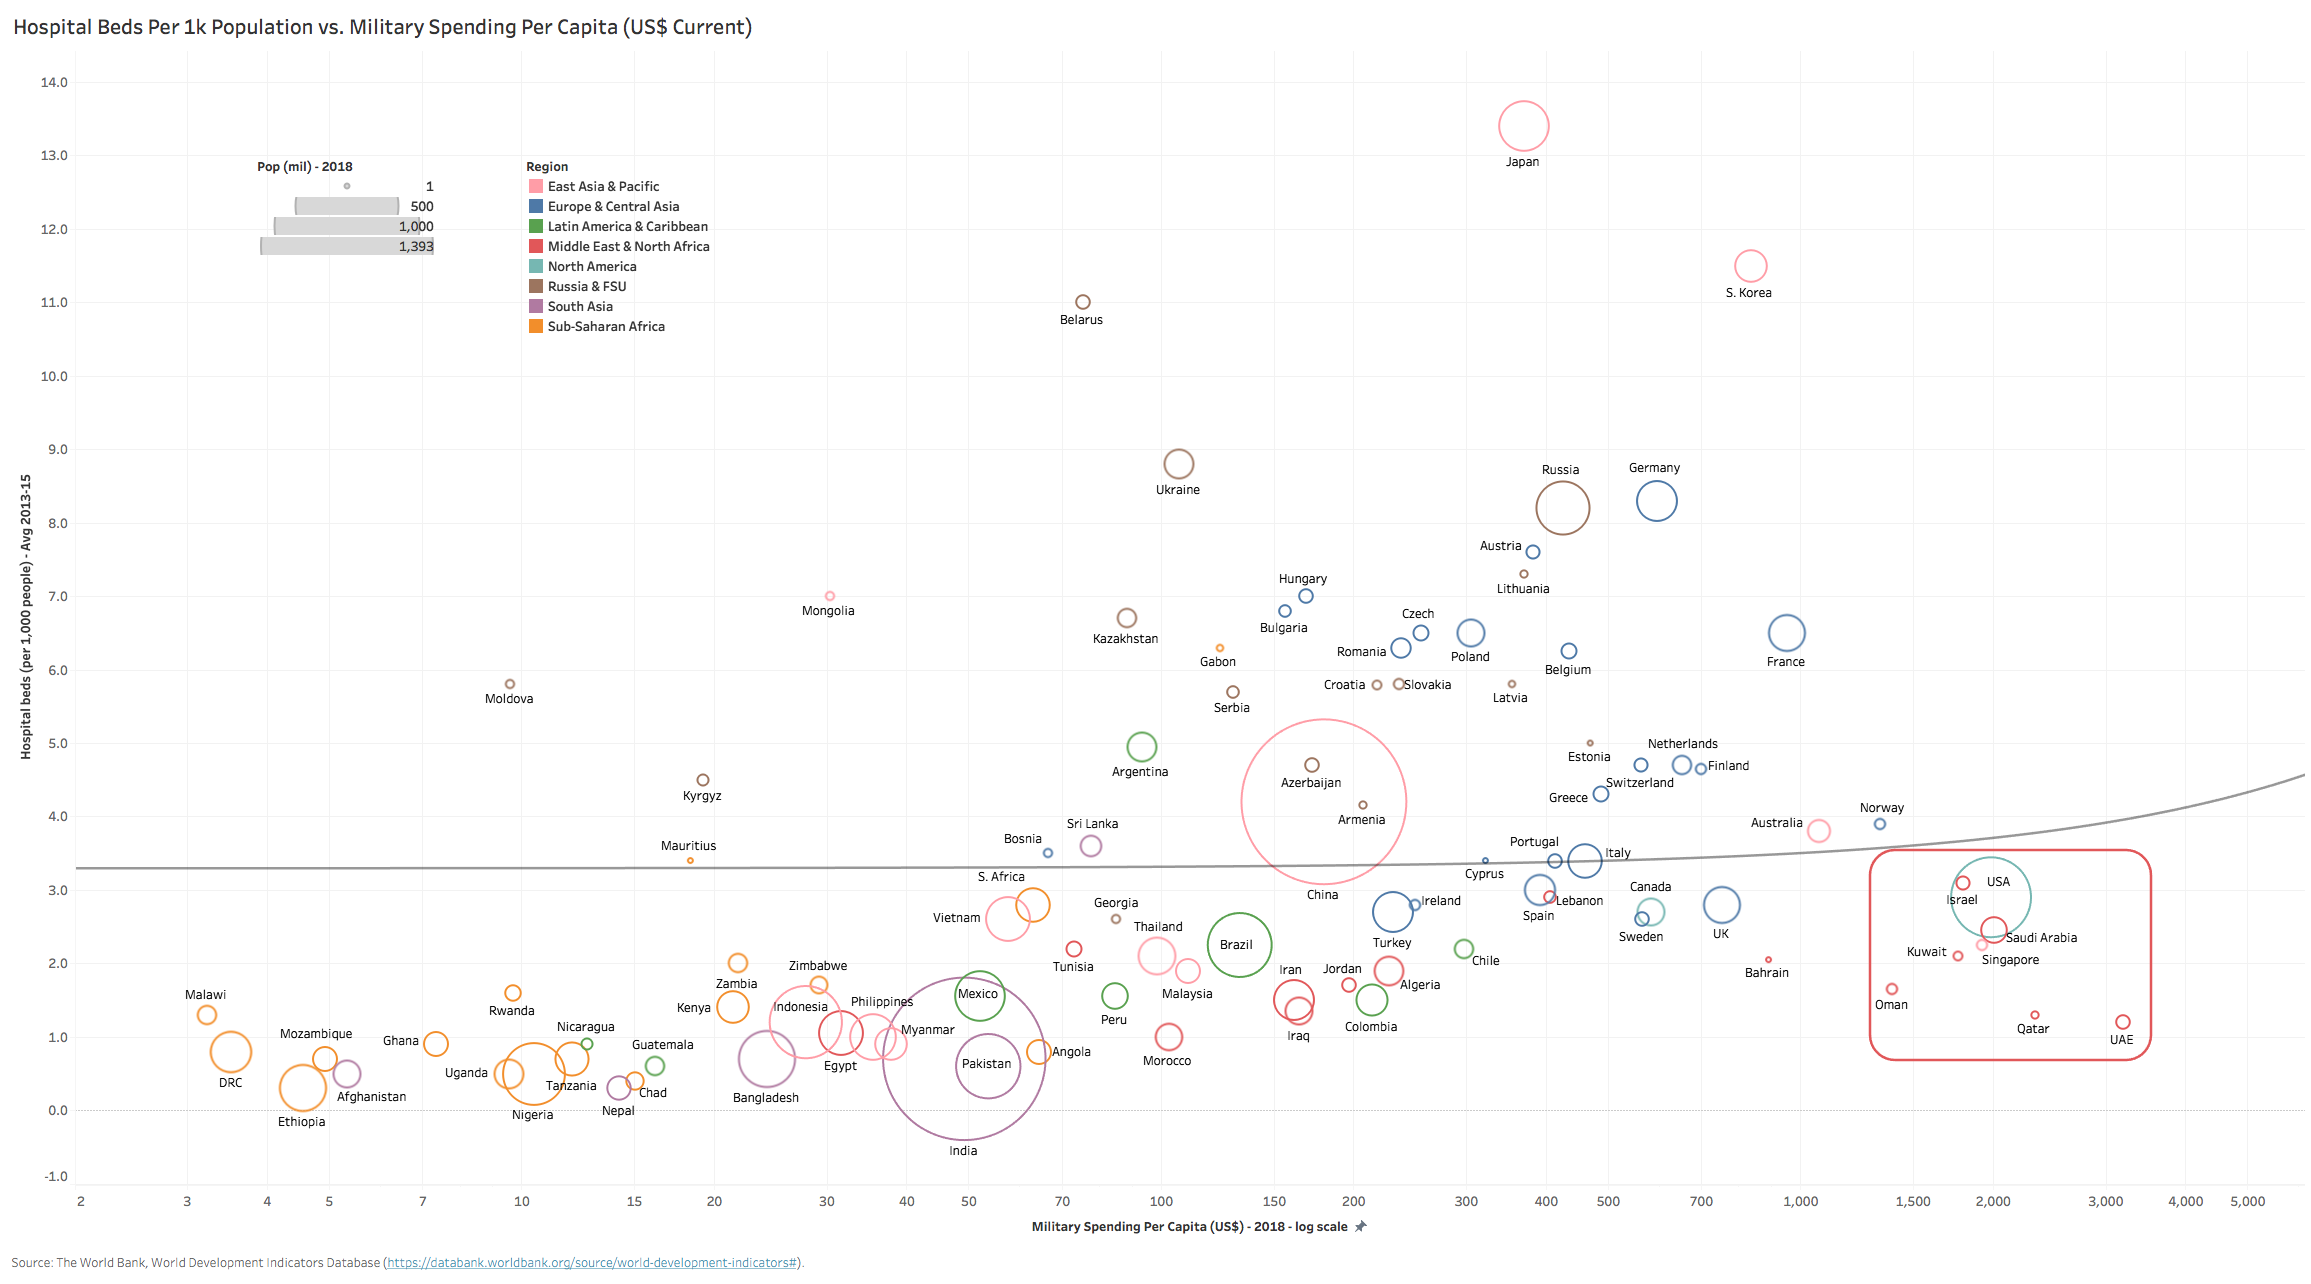
With already stretched healthcare systems for most countries, this pandemic will present a monumental challenge in emergency response and containment, especially for emerging market mega cities (> 10mil) where 30 of the 34 top cities are in developing countries. Middle East, Africa & Southern Asian (MEASA) countries are especially vulnerable to the expected stress from the COVID-19 pandemic due to weak healthcare infrastructure and systems. Sub-Saharan African (SSA) countries account for 23 of the bottom 50 globally in terms of hospital bed capacity (beds per 1k pop), while five of the six South Asian countries also rank in this category. In terms of physicians per 1k pop, SSA countries make up 30 of the bottom 50, with all countries scoring < 0.50 physician/1k pop (S. Africa is the highest at 0.83). This is not surprising in light of most countries’ tight budgets, though one would expect richer countries like S. Africa and Angola to fare far better.
Turning to rich countries in the GCC with highly developed infrastructure (generally) and very generous fiscal budgets, if one looks at bed or physician per pop relative to what these countries spend on military expenditures per pop (Charts 7 & 8 below) – they are complete outliers (along with the US, Israel & Singapore) – reflecting the disproportionate amount of resources they dedicate to military/defense at the obvious expense of basic social needs such as healthcare.
Lets hope the allocation of resources shifts markedly in the future – for the ‘haves’ and ‘have-nots’ alike.