

Looking at the current return on capital profiles for the GCC countries, a few things become abundantly clear: 1) overall GCC aggregate return on capital (7.5%) is now firmly below the blended cost of capital (7.7%), suggesting that based on the latest quarter performance, the GCC in aggregate is generating negative economic value-added, 2) with the lone exception of Kuwait, all individual market aggregate ROCs are below their cost of capital hurdle rates (Kuwait is an outlier in that less profitable SOE or sovereign-linked companies do not dominate the total market capitalization) and 3) this is despite very low corporate tax rates for most of the GCC (KSA is the exception here) – which if normalized to global averages (e.g. 35%) would push historical (15-yr) average ROCs for virtually every country to well below their cost of capital hurdles (see Chart 1 below where we modeled return profiles by country and sector groupings based on 25% and 35% corporate tax rates).
SOE dominance in most GCC stock markets and the resulting crowding-out of the private sector, is a key driver for these low returns in our opinion. For every positive EVA private sector company (e.g. an Aramex, Humansoft or Jarir), their collective economic value added is overwhelmed by the massive value destruction of giant SOEs like SABIC, Industries Qatar, Etihad Airways or even Emirates Airlines (see our 2019 post on GCC Airlines: https://www.linkedin.com/pulse/middle-east-airlines-strategic-diversifiers-serial-capital-zuaiter). In a structurally low oil price environment, where government revenues are challenged and economic growth sharply contracts, shouldn’t the path to value creation lie in aggressively growing the private sector?
Chart 1: GCC Summary of Returns on Capital (Aggregate, By Country, Financials & Non-Financials) – Latest Quarter & 15-Year Averages

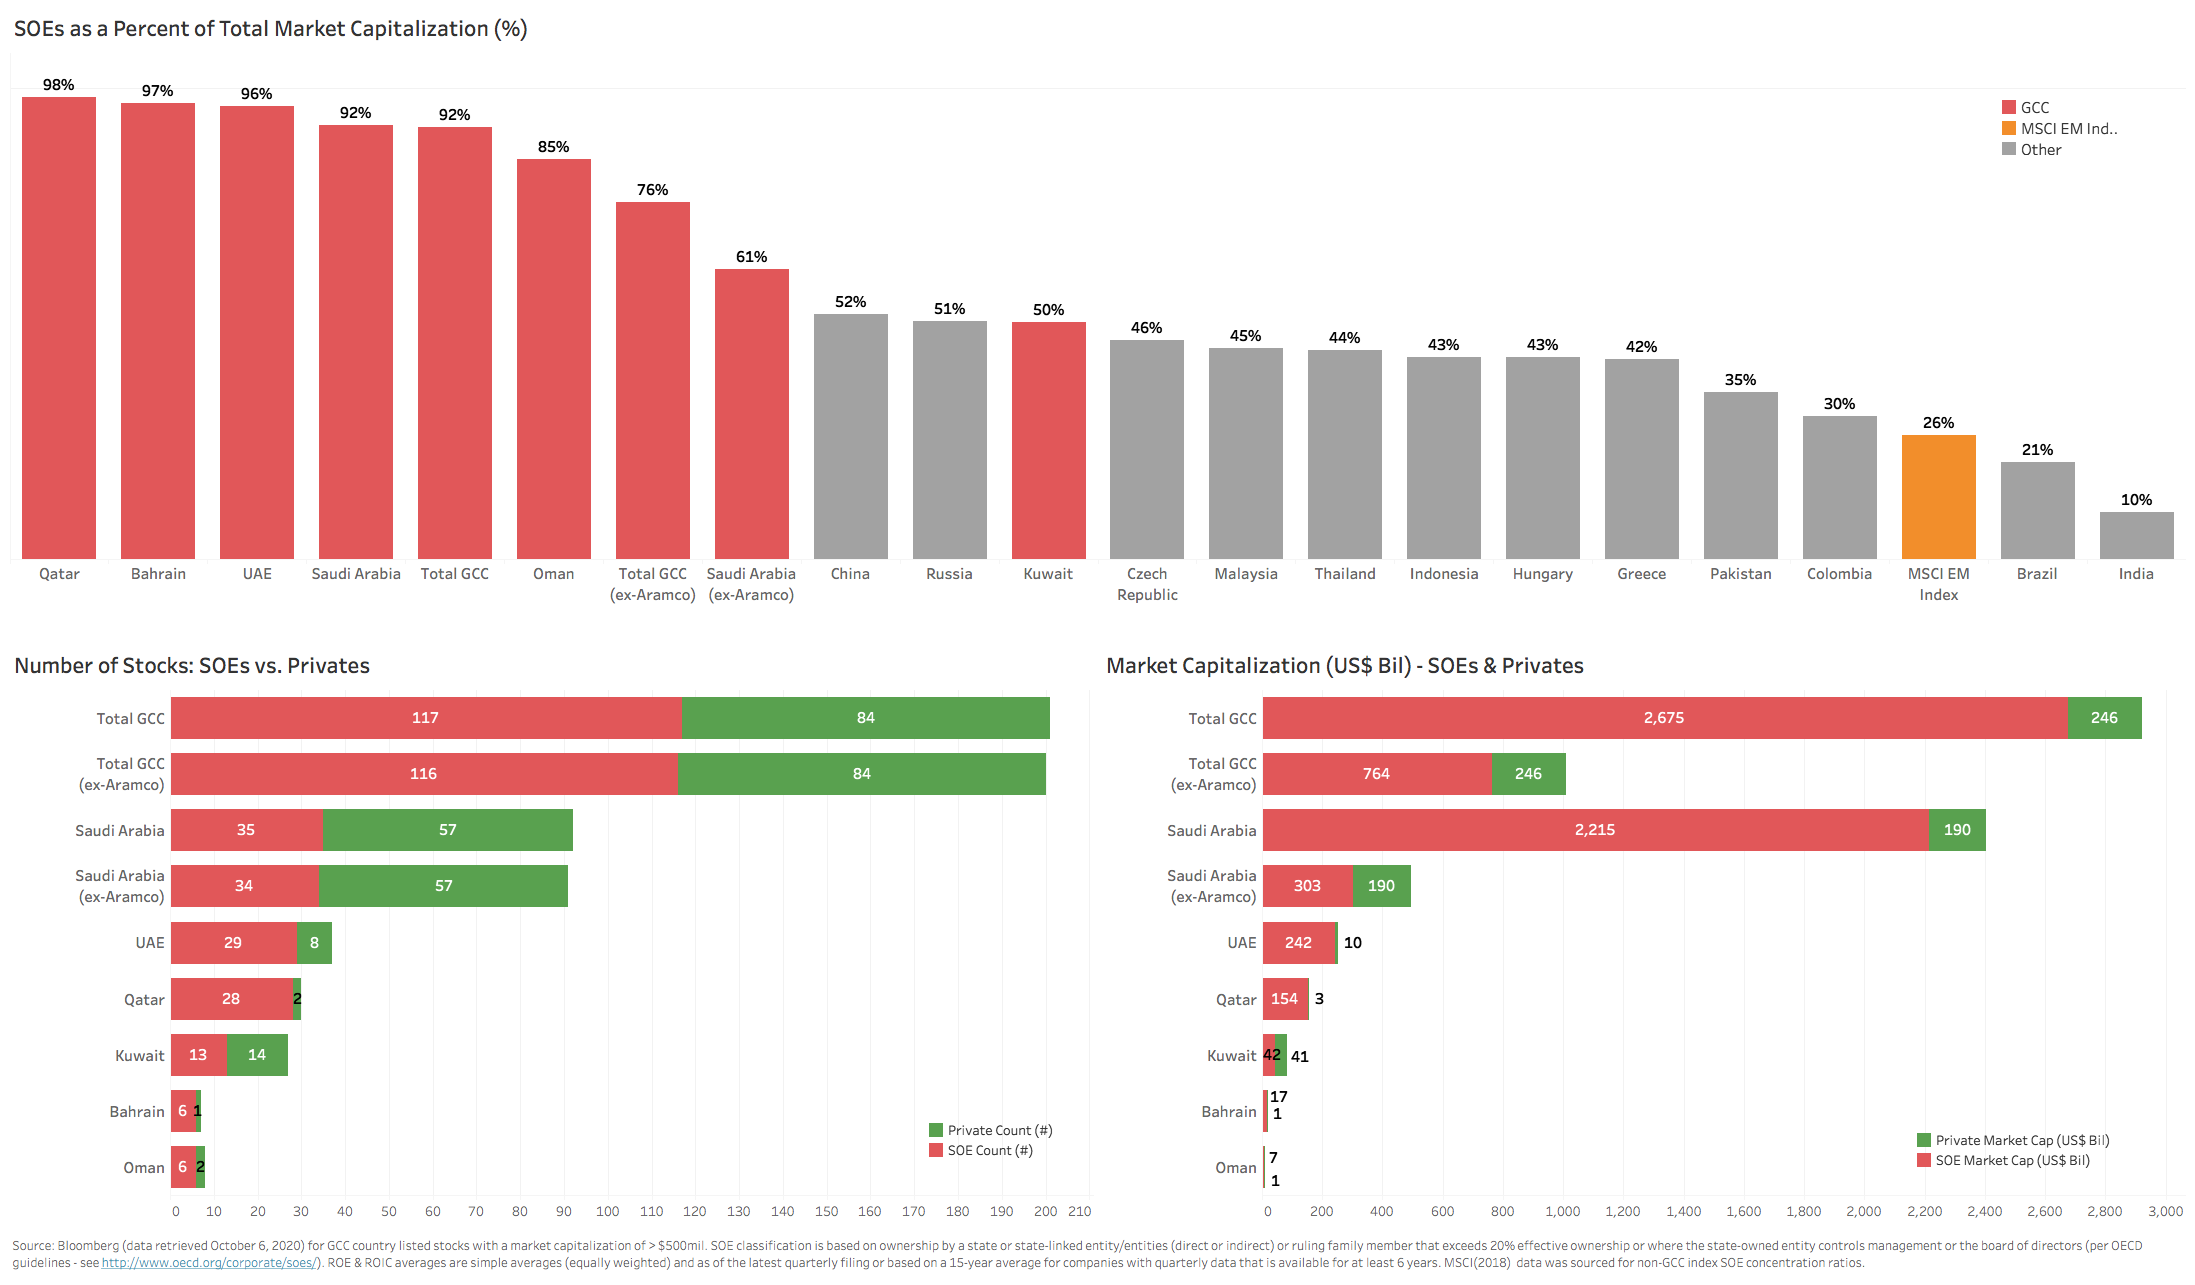
GCC stock markets continue to be huge outliers in an emerging markets context in terms of the weight of SOEs (state-owned entities) in their stock market capitalizations. For example, SOE weights in Russia (51%) and even China (52%) pale in comparison to the likes of the UAE (96%) and Qatar (98%) – see Chart 2 below. Saudi Arabia is a bit more balanced if Aramco is excluded (62%), with its total SOE weight rising to 92% with Aramco’s addition. Kuwait is the most balanced market with a 50/50 split between SOE and private. The smaller markets (Oman, Bahrain) have only three stocks between them that are non-SOE owned, while even the larger Qatari market can only claim 3 credible non-SOE stocks. Those markets with a large enough sample of private names (Saudi and Kuwait) show the large divergence in returns on capital between private and SOE groupings, with ROE premiums for the privates ranging from 200bps to 300bps; in both cases, privates handily outperform the overall country ROE average.
Chart 2: GCC SOE Concentration
With 4/6 GCC countries having made their way into the MSCI EM Index of late (Kuwait joins next month), it is worthwhile looking at how emerging market SOEs have fared relative to their private-sector cohorts over the past decade. WisdomTree (an ETF provider with a $2.2 billion ex-SOE ETF for emerging markets) has shed some light on this phenomenon. Data from WisdomTree suggests a meaningful underperformance of returns for EM SOE names on a 5- & 10-year historical basis (500-700bps; see Charts 3-5 below). For context, SOEs make up roughly 26% of the MSCI Emerging Markets Index (as of December 2018). This concentration level is most likely higher in 2020 post the March 2019 inclusion of the China A-Shares to the index, which elevated China SOEs to nearly 15% of the MSCI EM Index (according to Callan – see: https://www.callan.com/em-soe/).
Chart 3: Emerging Markets – SOE & Non-SOE Returns (WisdomTree ETF)
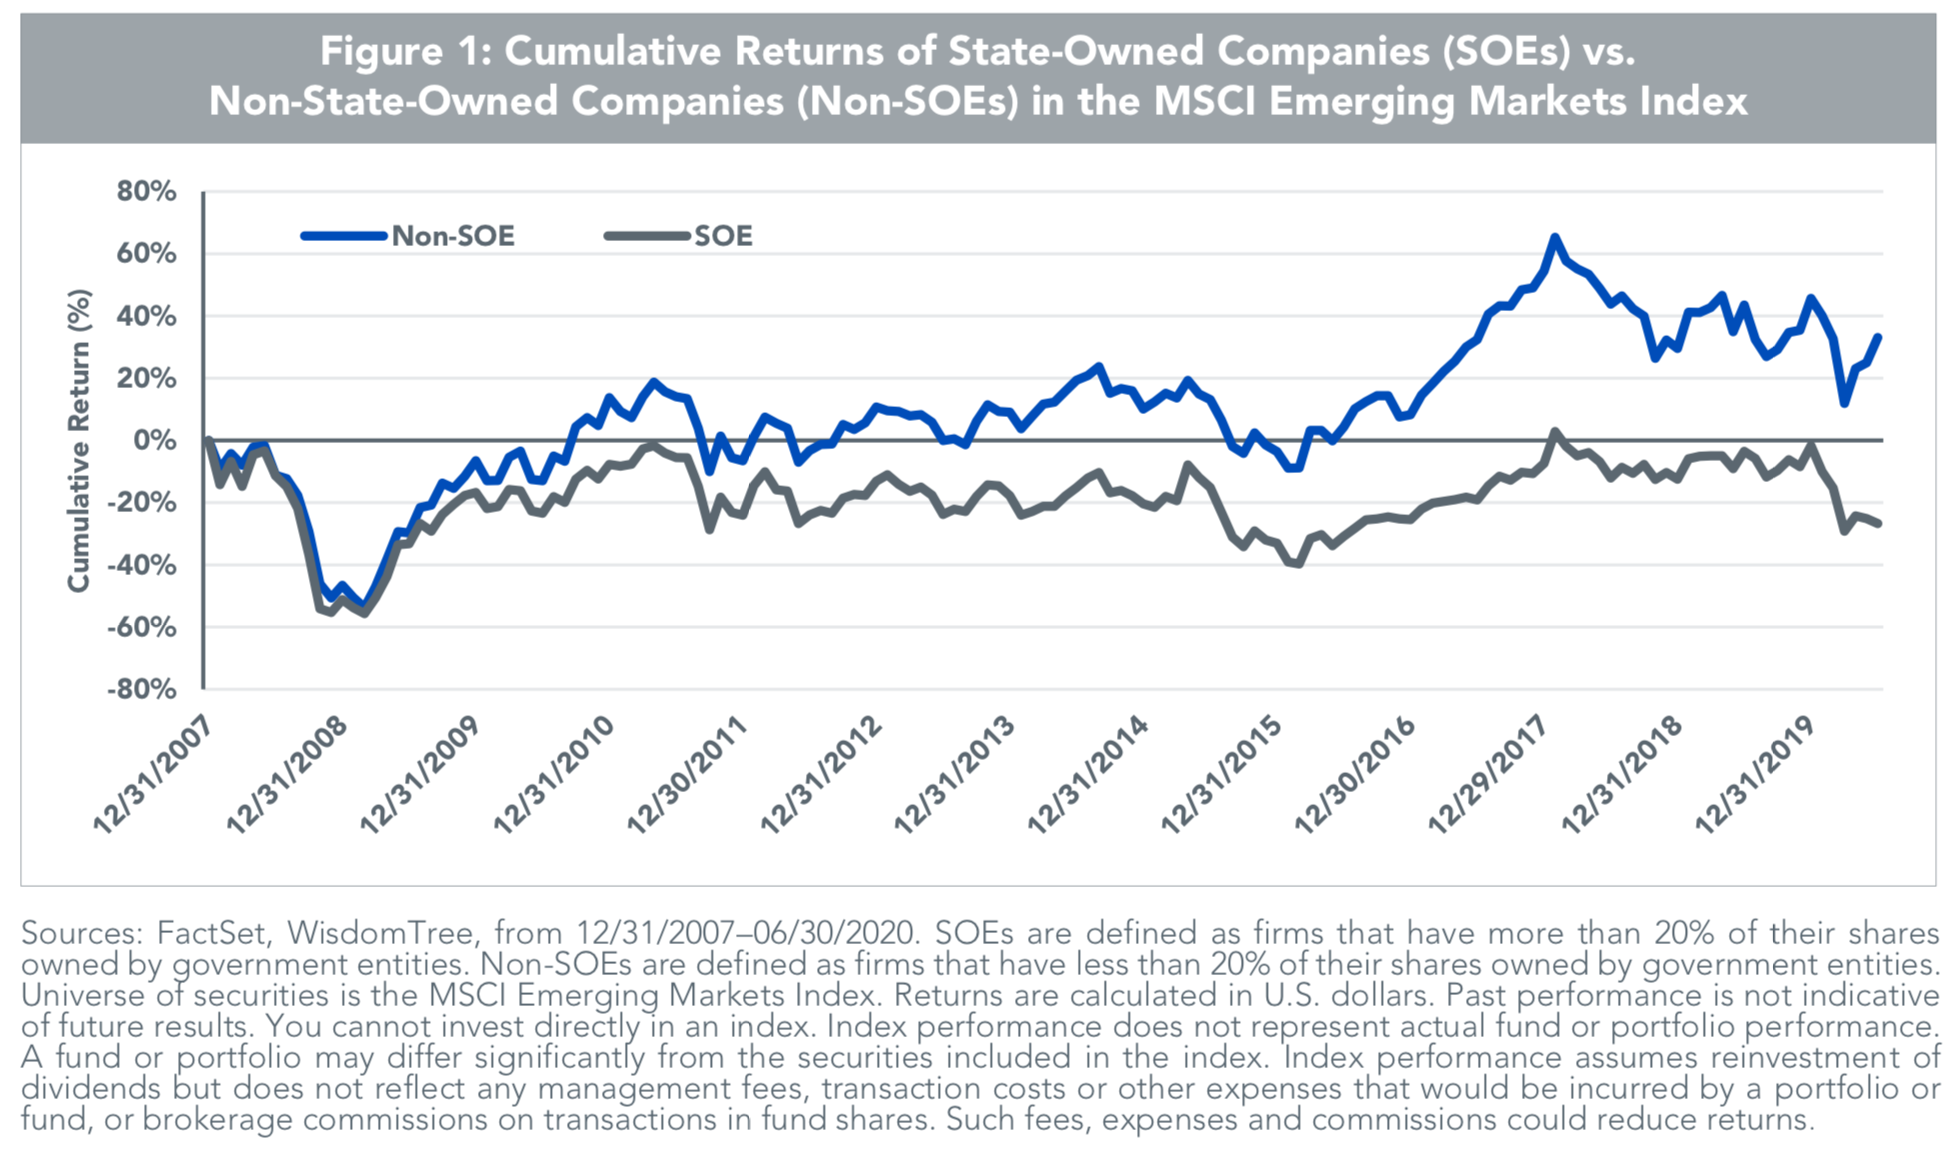

Chart 4: Emerging Markets – SOE & Non-SOE, ROE & ROA Trends (WisdomTree ETF)
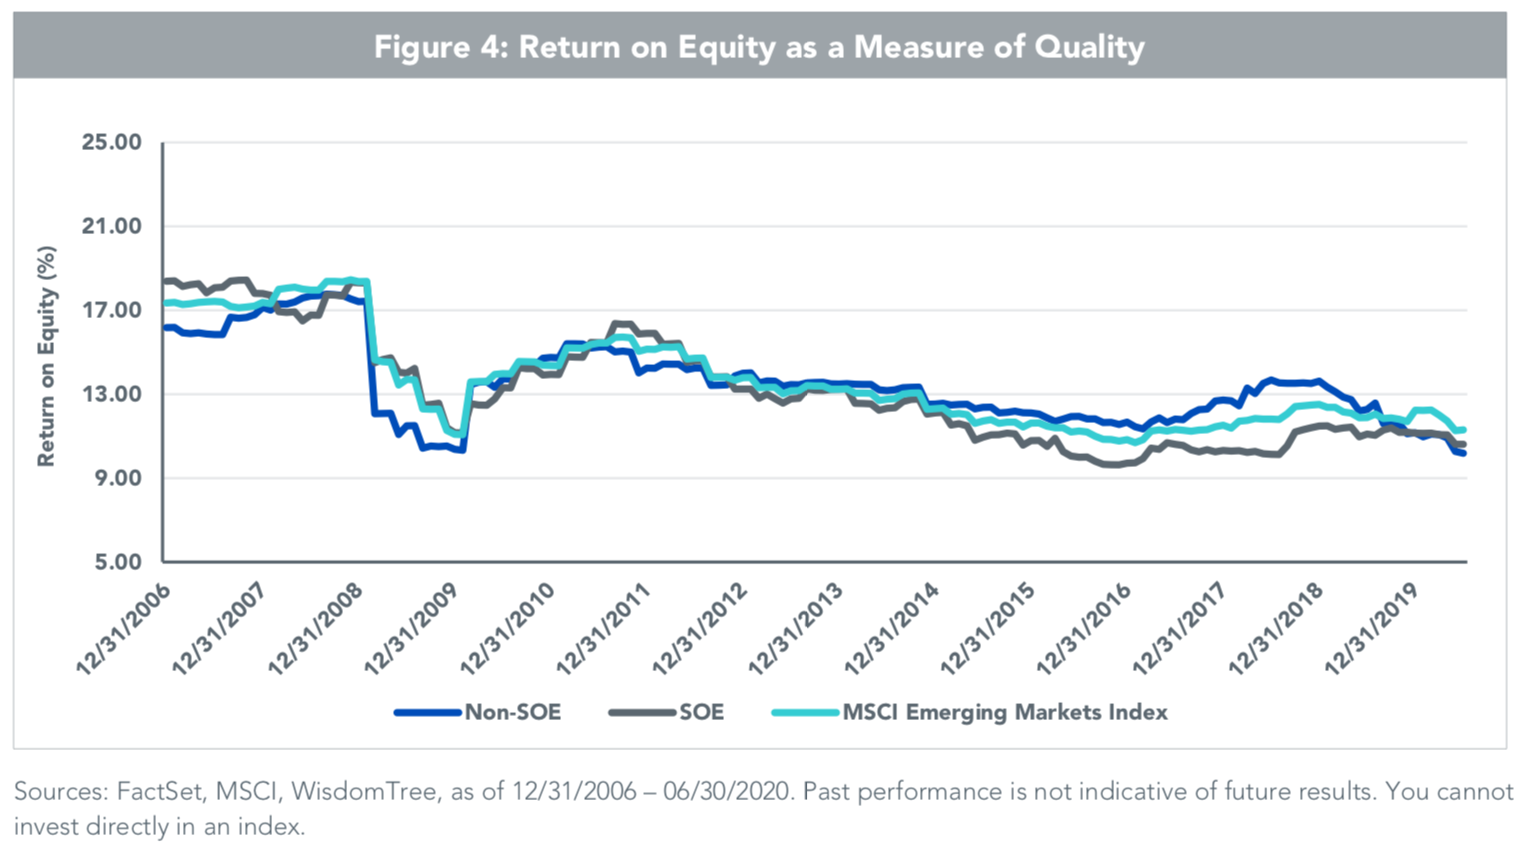
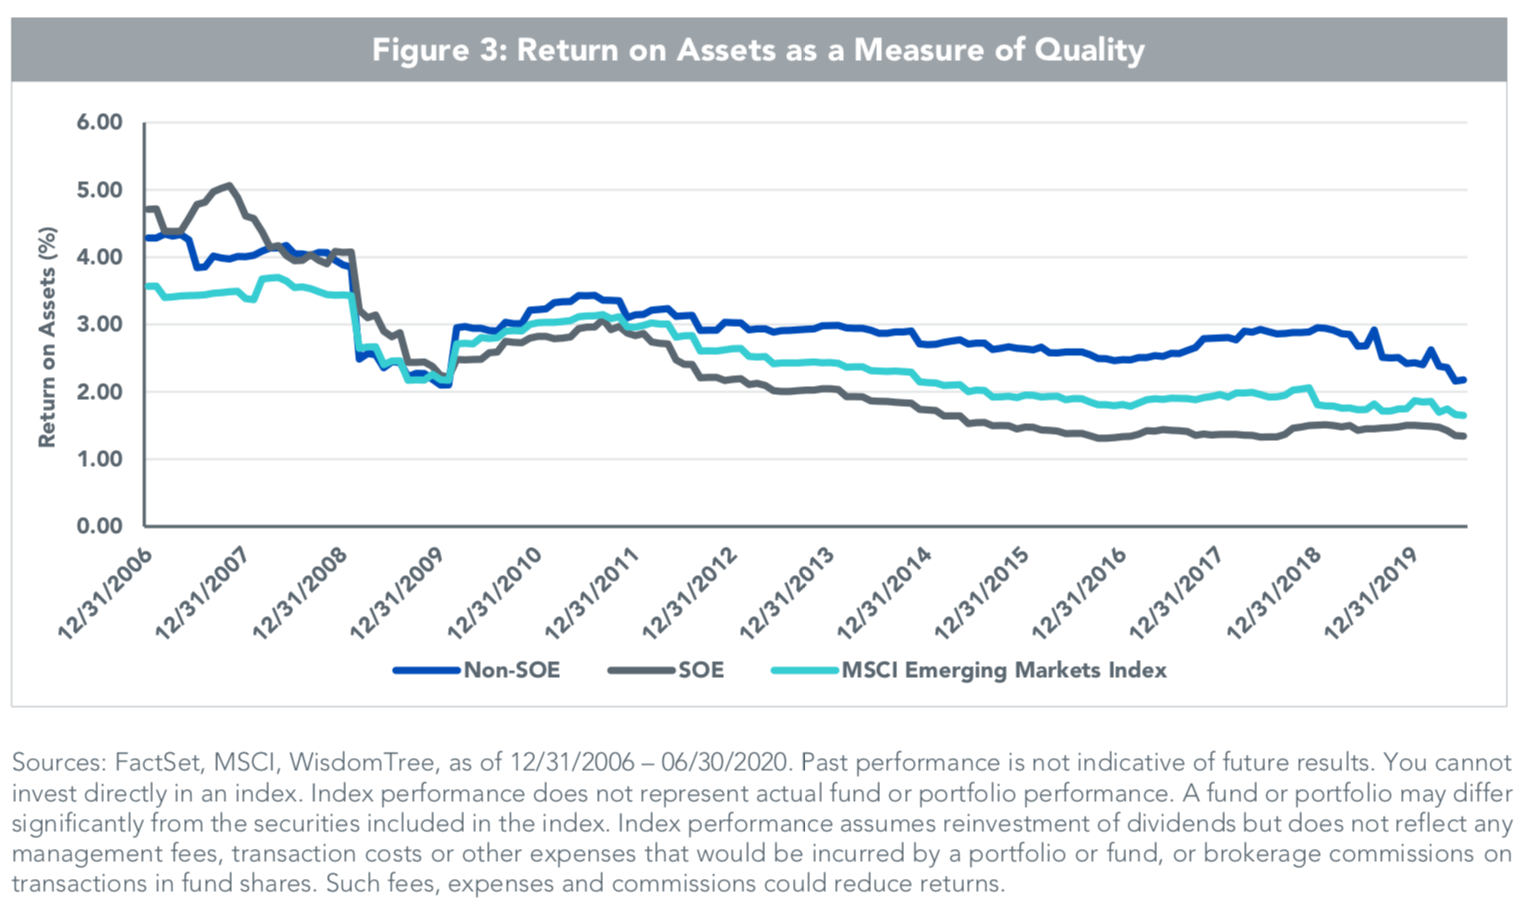
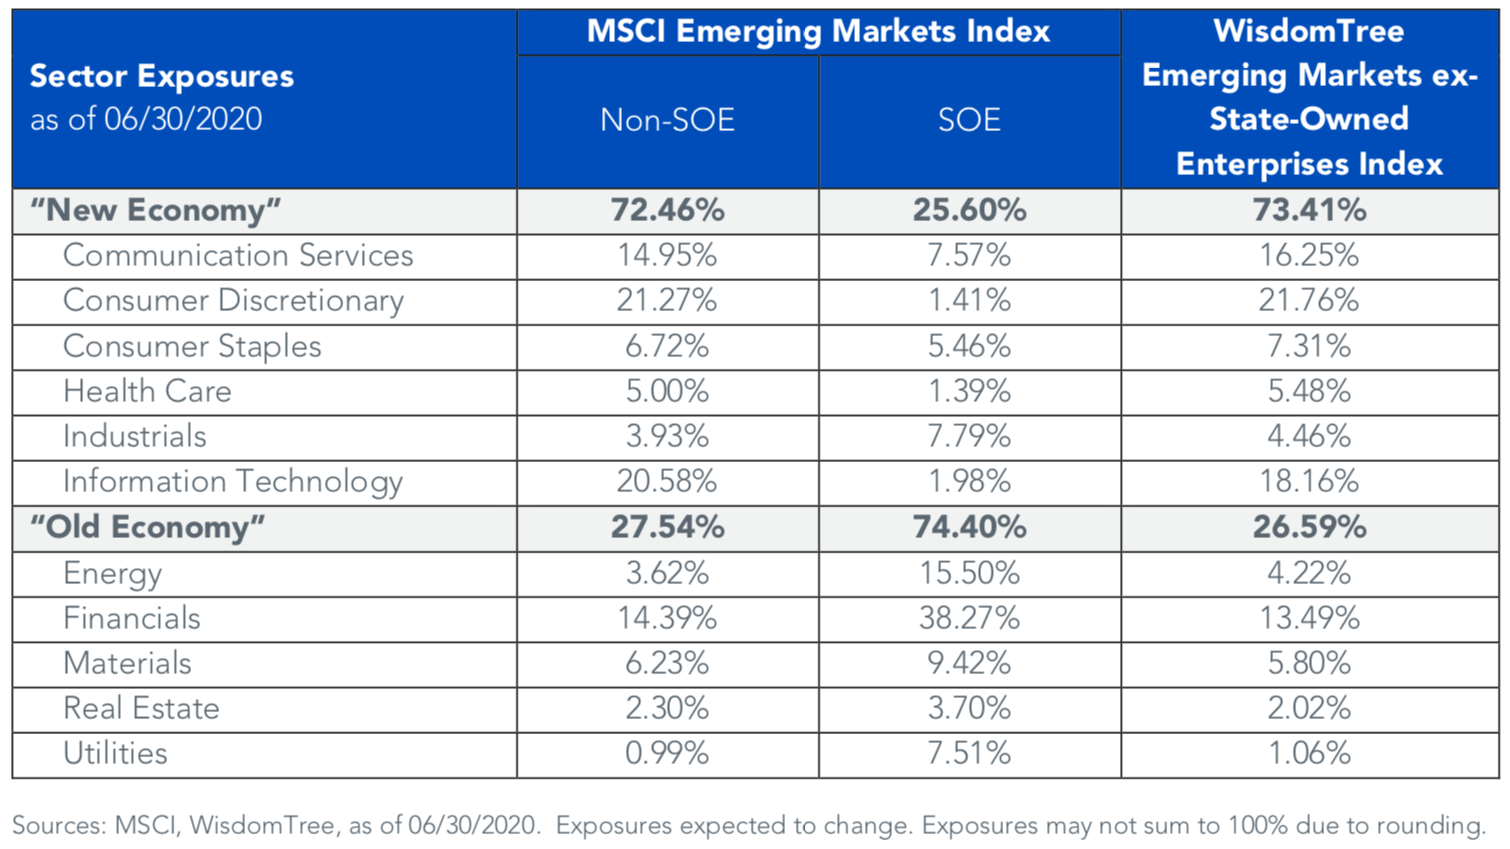
Chart 5: Emerging Markets – SOE & Non-SOE Weights & Sector Exposures (WisdomTree ETF)
The driver for this underperformance is somewhat intuitive in our opinion. SOEs by definition introduce a clear misalignment of interests (both strategic and financial) between those of the state and the interests of minority shareholders. This in turn not only introduces a critical agency problem through elevated governance risks, but also has empirically led to poor allocation of capital. State incentives tend to favor the maximization of social or political benefits (e.g. absorbing excess labor, sponsoring public-sector projects, keeping staple product prices affordable, etc.) vs. maximizing overall stakeholder value. SOEs also tend to suffer from state-enabled managerial entrenchment and lack of accountability to a wider governance base, which results in a far less aligned and incentivized management. This tends to mirror the autocratic and top-down, command-oriented political frameworks of the host governments. As a consequence, SOE company managers are undeterred in over-investing or ’empire building’. Finally, in countries where the banking system is also SOE-dominated, SOEs tend to benefit disproportionately from concessional debt terms, preferential bank loan financing and thus a substantially subsidized cost of capital. This ends up crowding out the private sector from all forms of capital and resources.
The commonly cited counter argument is that SOE involvement/influence may in fact reduce the risk profile of the company (explicit sovereign backing, funder of last resort, or a protected moat in terms of tightly regulated competition- banks and telcos are the obvious examples here). But as ever, with a lower risk profile and a subsidized cost of capital, returns on capital tend to eventually fall in tandem while operational efficiency and capital productivity suffer. This negative impact on profitability and capital efficiency is compounded in countries where a legacy socialist culture/framework still lingers and SOEs are viewed as instruments of the state for interventions in the market mechanism (for social, political, or economic objectives) or even a lever to control key elements of society.
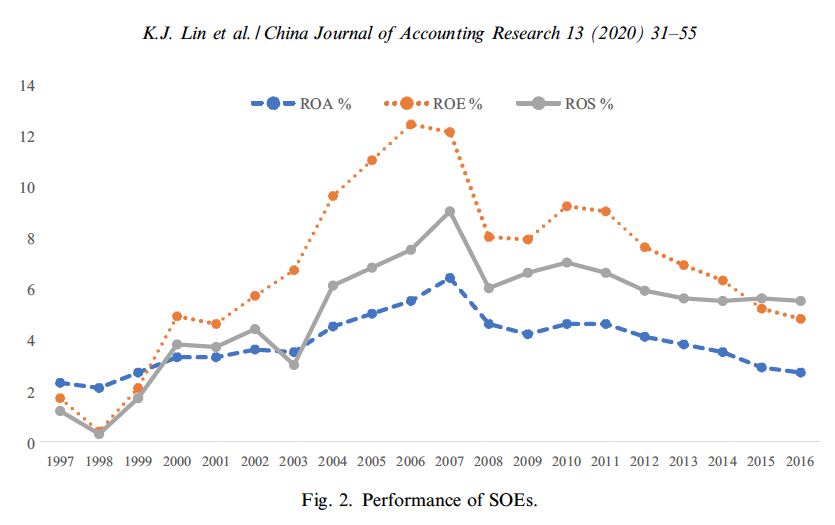
China is a prime example of where SOE dominance over several decades has structurally impacted overall returns on capital. Despite the obvious benefits that SOE dominance has provided the state (China’s exceptionally high GDP growth rates are no doubt a big positive dividend), returns on capital for at least the SOE sector in China’s stock market (52% of total market capitalization) have de-rated markedly since they peaked in 2006 (Chart 6 below). This is also despite the raft of key reforms to the SOE sector in the past 4 decades (see: https://www.researchgate.net/publication/339293581_State-owned_enterprises_in_China_A_review_of_40_years_of_research_and_practice). The authors of this report do a fantastic job of describing this reform journey, but come up well short of coherently rationalizing how the Chinese SOE dominance is in fact a contributor to China’s productivity-led growth phenomenon, especially during the last decade.
Chart 6: Chinese SOEs – Historical Returns on Capital (1997-2016)
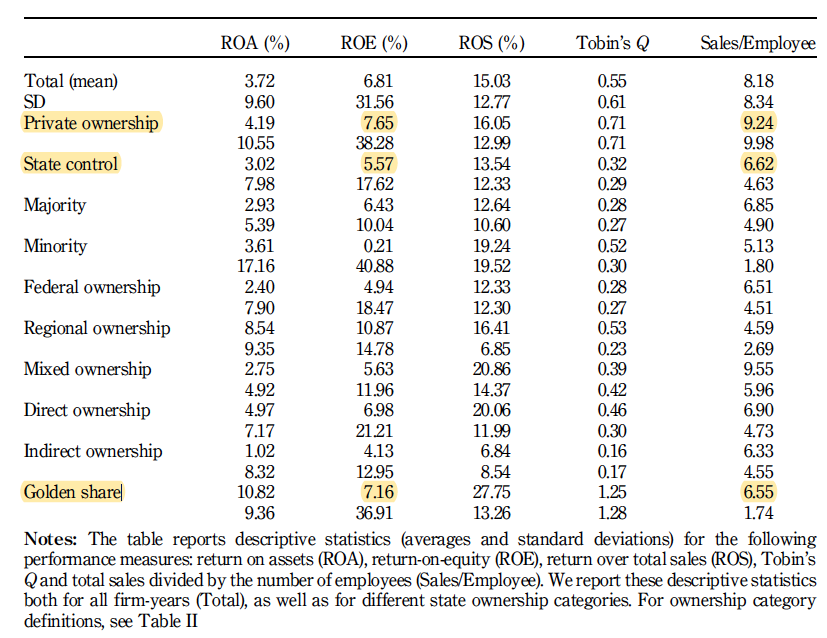
Russia is also a good analog for the GCC that is worth consideration. A 2019 report on Russian SOEs (https://www.emerald.com/insight/content/doi/10.1108/IJOEM-08-2017-0287/full/html) echoes much of the negative performance effects witnessed in China, but finds meaningful differences in performance relating to varying forms of state ownership. The study found that the relationship between state ownership and profitability amongst Russian firms becomes positive in sectors where state firms enjoy lower competition (e.g. extractive industries and highly regulated sectors where monopolistic tendencies are most prevalent or where barriers to entry are highest). They also found that state control through golden shares (as opposed to outright majority ownership or board/management control) typically results in better performance vs. other SOEs (see Chart 7 below).
Most interestingly, the authors found that despite the better performance of ‘protected’ or ‘golden share’ Russian SOEs, neither grouping’s higher profitability ended up translating into higher valuation ratings during this period. This makes sense to us, since in most integrated financial markets where minority foreign investors play a disproportionately larger impact in influencing valuations (they tend to be the marginal buyers), the cloud of poor governance tends to overwhelm even the reality of superior profitability. This seems to be the case for most EM SOE valuations (i.e. discounts to their market averages) we have looked at and is especially noteworthy for highly regulated/protected sectors where SOE dividend yields tend to be higher than the market average. This has important implications for several GCC SOE sector groupings (banks and telcos) discussed below.
Chart 7: Russia’s SOE vs. Private Returns on Capital (2011-2015)
Back to the GCC. Even though returns for GCC SOEs trail those of private sector companies, the overall average and the blended cost of capital (Chart 8 below), two large SOE sectors have in fact outperformed their private counterparts and have generated positive EVA – at least on a 15-year historical basis. GCC SOE telecoms and banks have historically generated returns on capital in excess of their cost of capital, however recent trends (the past 5 years) suggest that this positive EVA profile may in fact be weakening.
For SOE telecoms, one can argue that the regulatory protection of the legacy SOE providers is gradually being eroded by both highly disruptive competing technologies (many of which emanate from outside their national borders) and falling incremental profitability of legacy telecom services (incremental ROIC trends for 8/10 SOE telcos are falling – see Chart 12 below). With telecom volumes expected to fall in several countries due to shrinking migrant populations and lower subscriber usage, the prospect of negative operating leverage for such a capital intensive model is daunting.
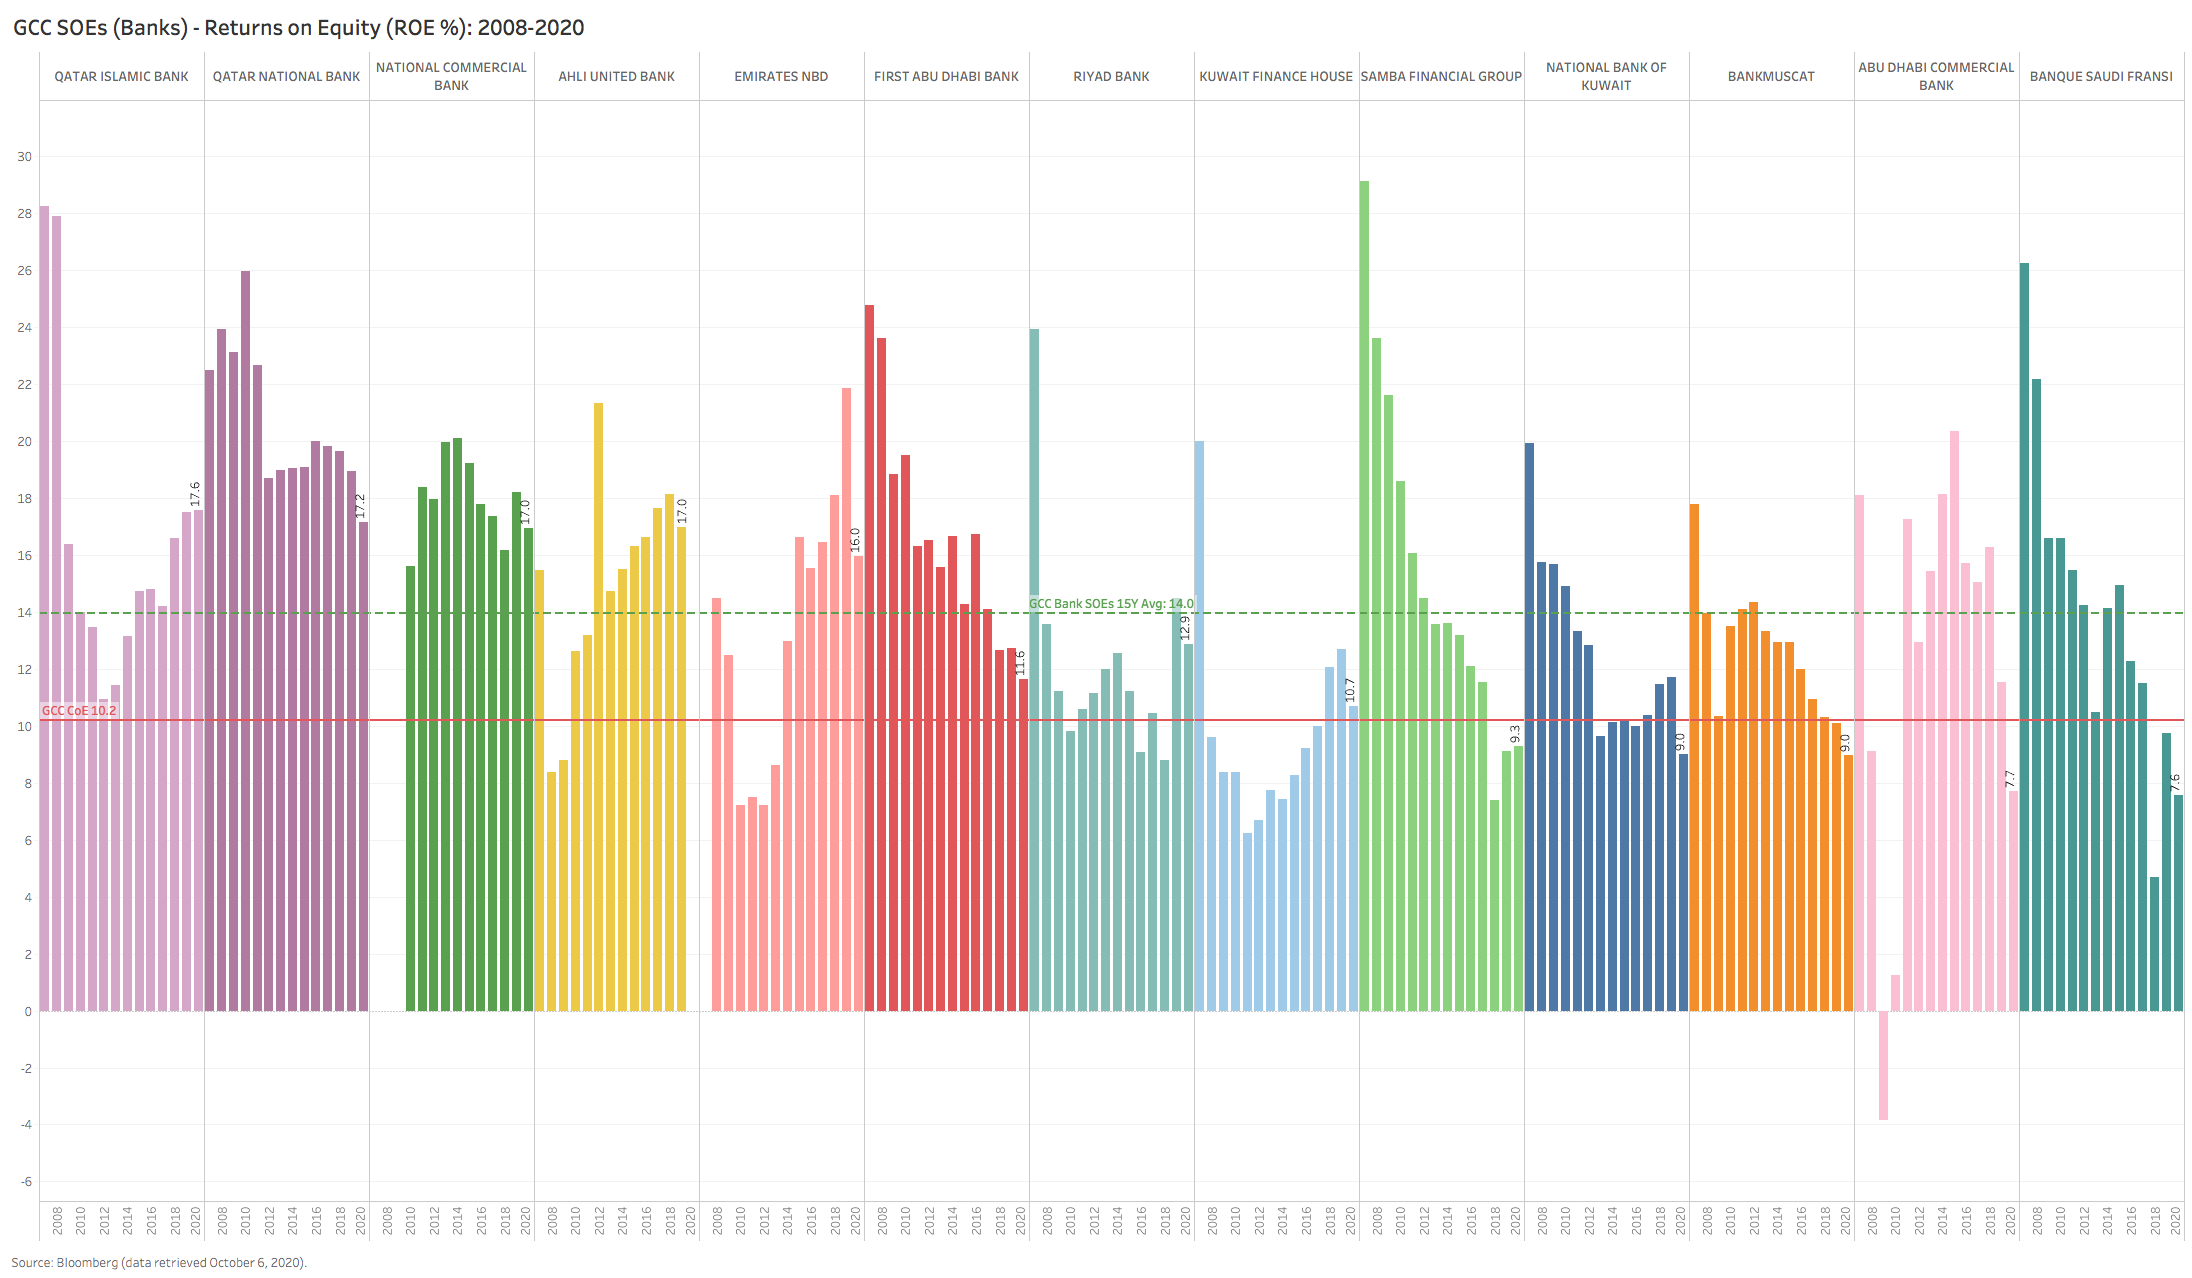
For SOE banks, the same disruptive challenge is manifesting itself via the emergence of FinTechs that are gradually dis-intermediating transaction revenues (e.g. via mobile payments), while net interest margins on the legacy lending business are in decline due to structurally low US$-linked interest rates (5/6 GCC currencies are pegged to the US$). As a result, like with the telcos, despite the majority of banks generating positive EVA in 2019/20, ten of the thirteen banks profiled (see Chart 13 below) are exhibiting falling ROEs over the past 5 years.
Away from the telcos and banks, the other major sectors where SOEs are dominant (real estate, utilities, industrials, materials) all show both highly negative EVA (where the returns on capital are significantly below the cost of capital) and sharply deteriorating ROC trends. In all cases, and due to the high fixed-cost and capital-intensive nature of these industries, these SOE in many cases are now facing very high levels of negative operating leverage, where high positive returns profiles of the past 15 years are now (in some cases) negative (e.g. SABIC, IQ, most of the GCC SOE petrochemical names, and several of the real estate companies – see Charts 9-11 below).
Chart 8: GCC SOE & Privates Return Summary
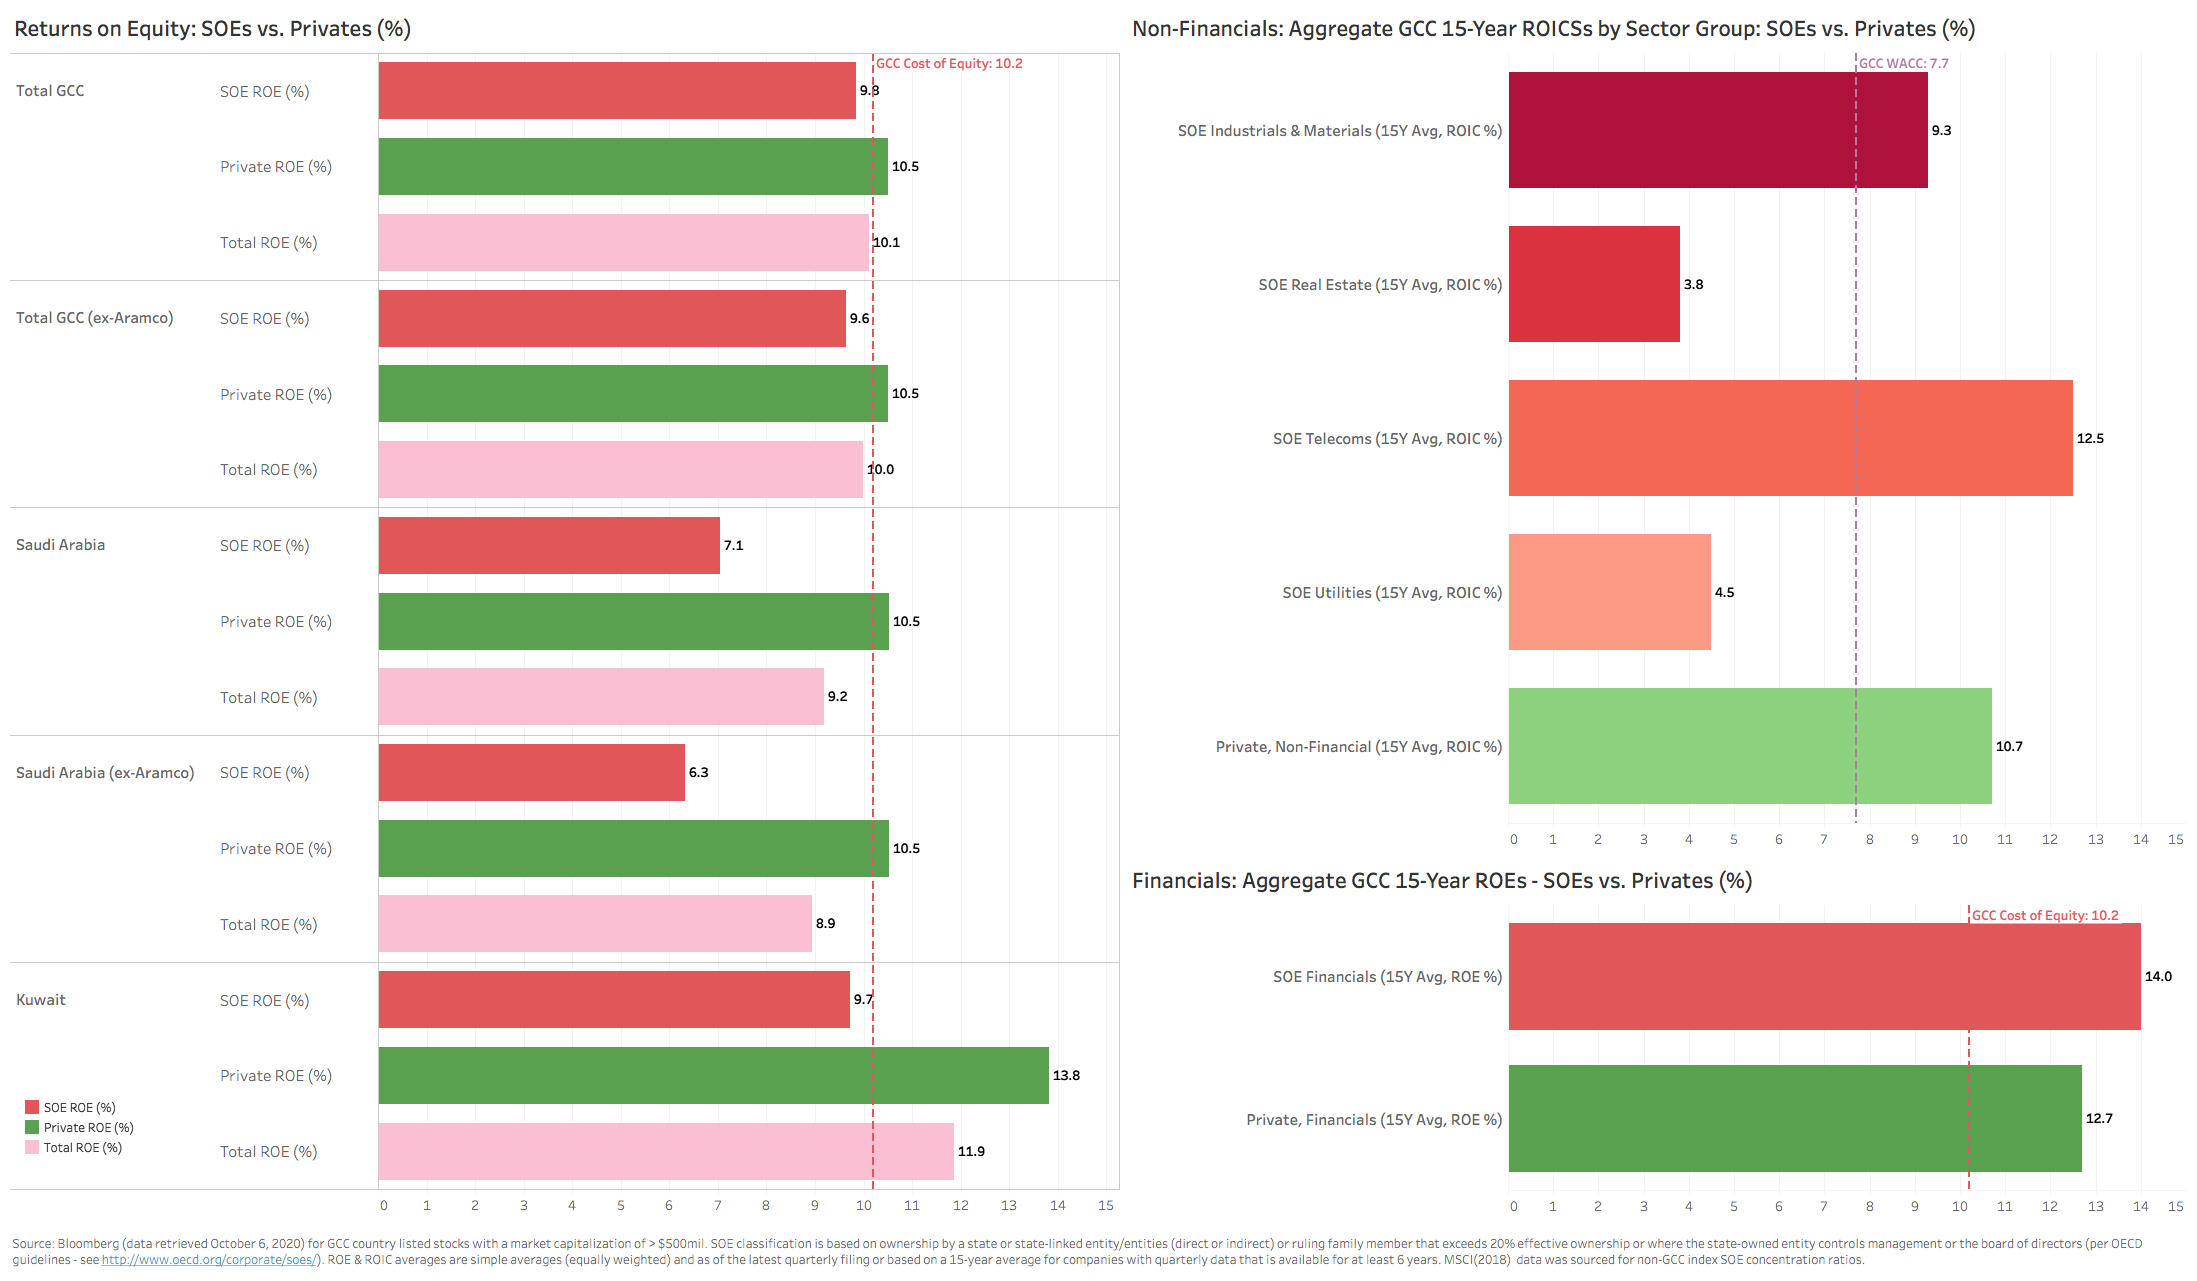
Chart 9: GCC SOE Sample (Industrials & Materials) – ROICs (2008-2020)

Chart 10: GCC SOE Sample (Real Estate) – ROICs (2008-2020)
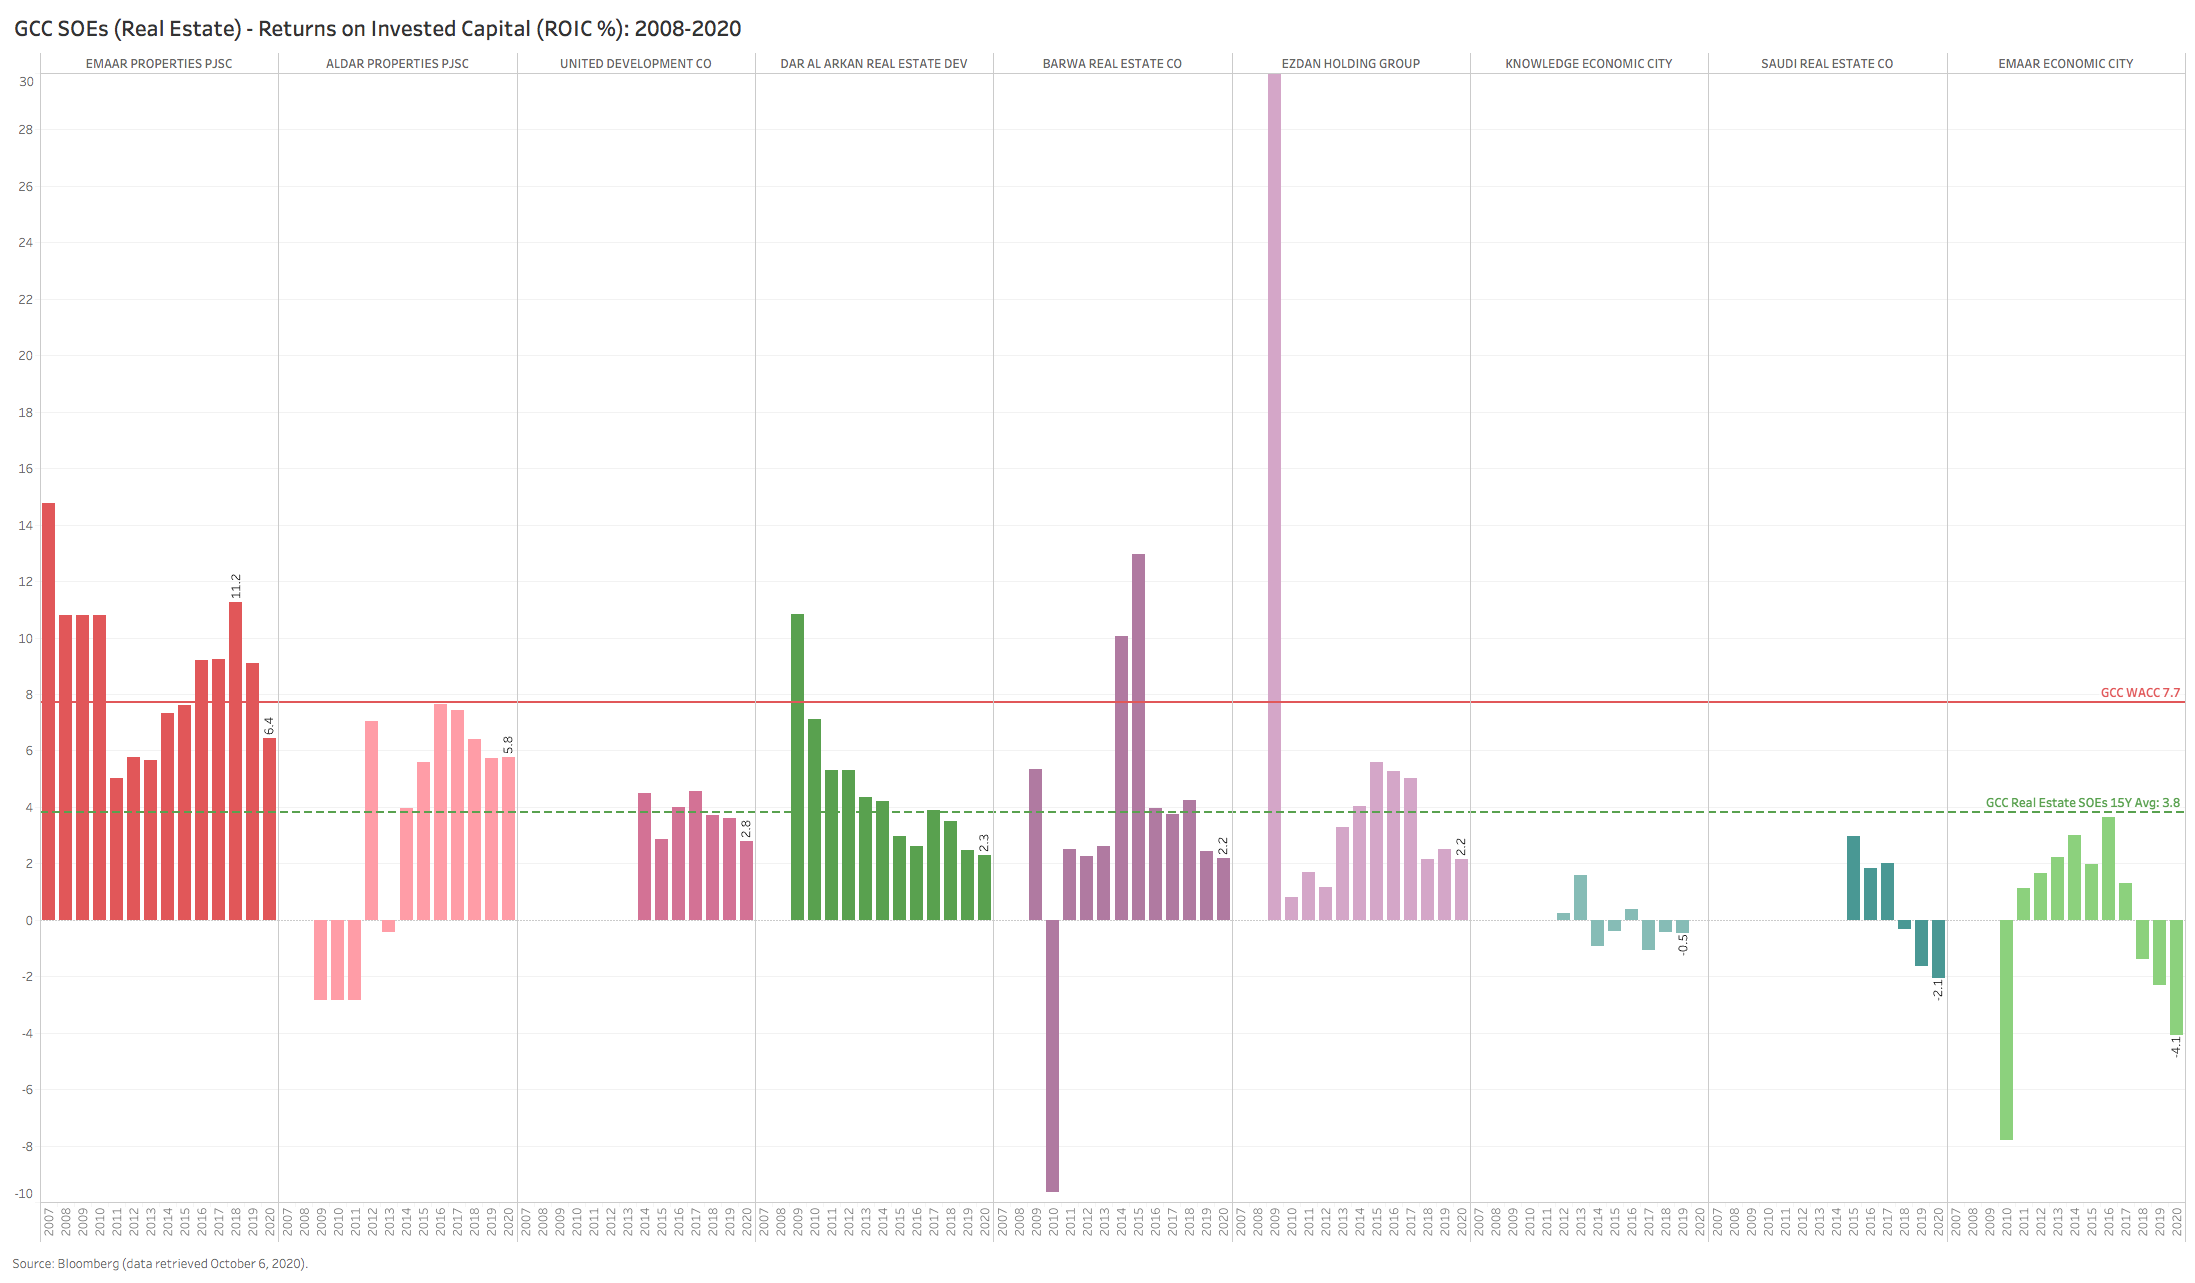
Chart 11: GCC SOE Sample (Utilities) – ROICs (2008-2020)

Chart 12: GCC SOE Sample (Telecoms) – ROICs (2008-2020)
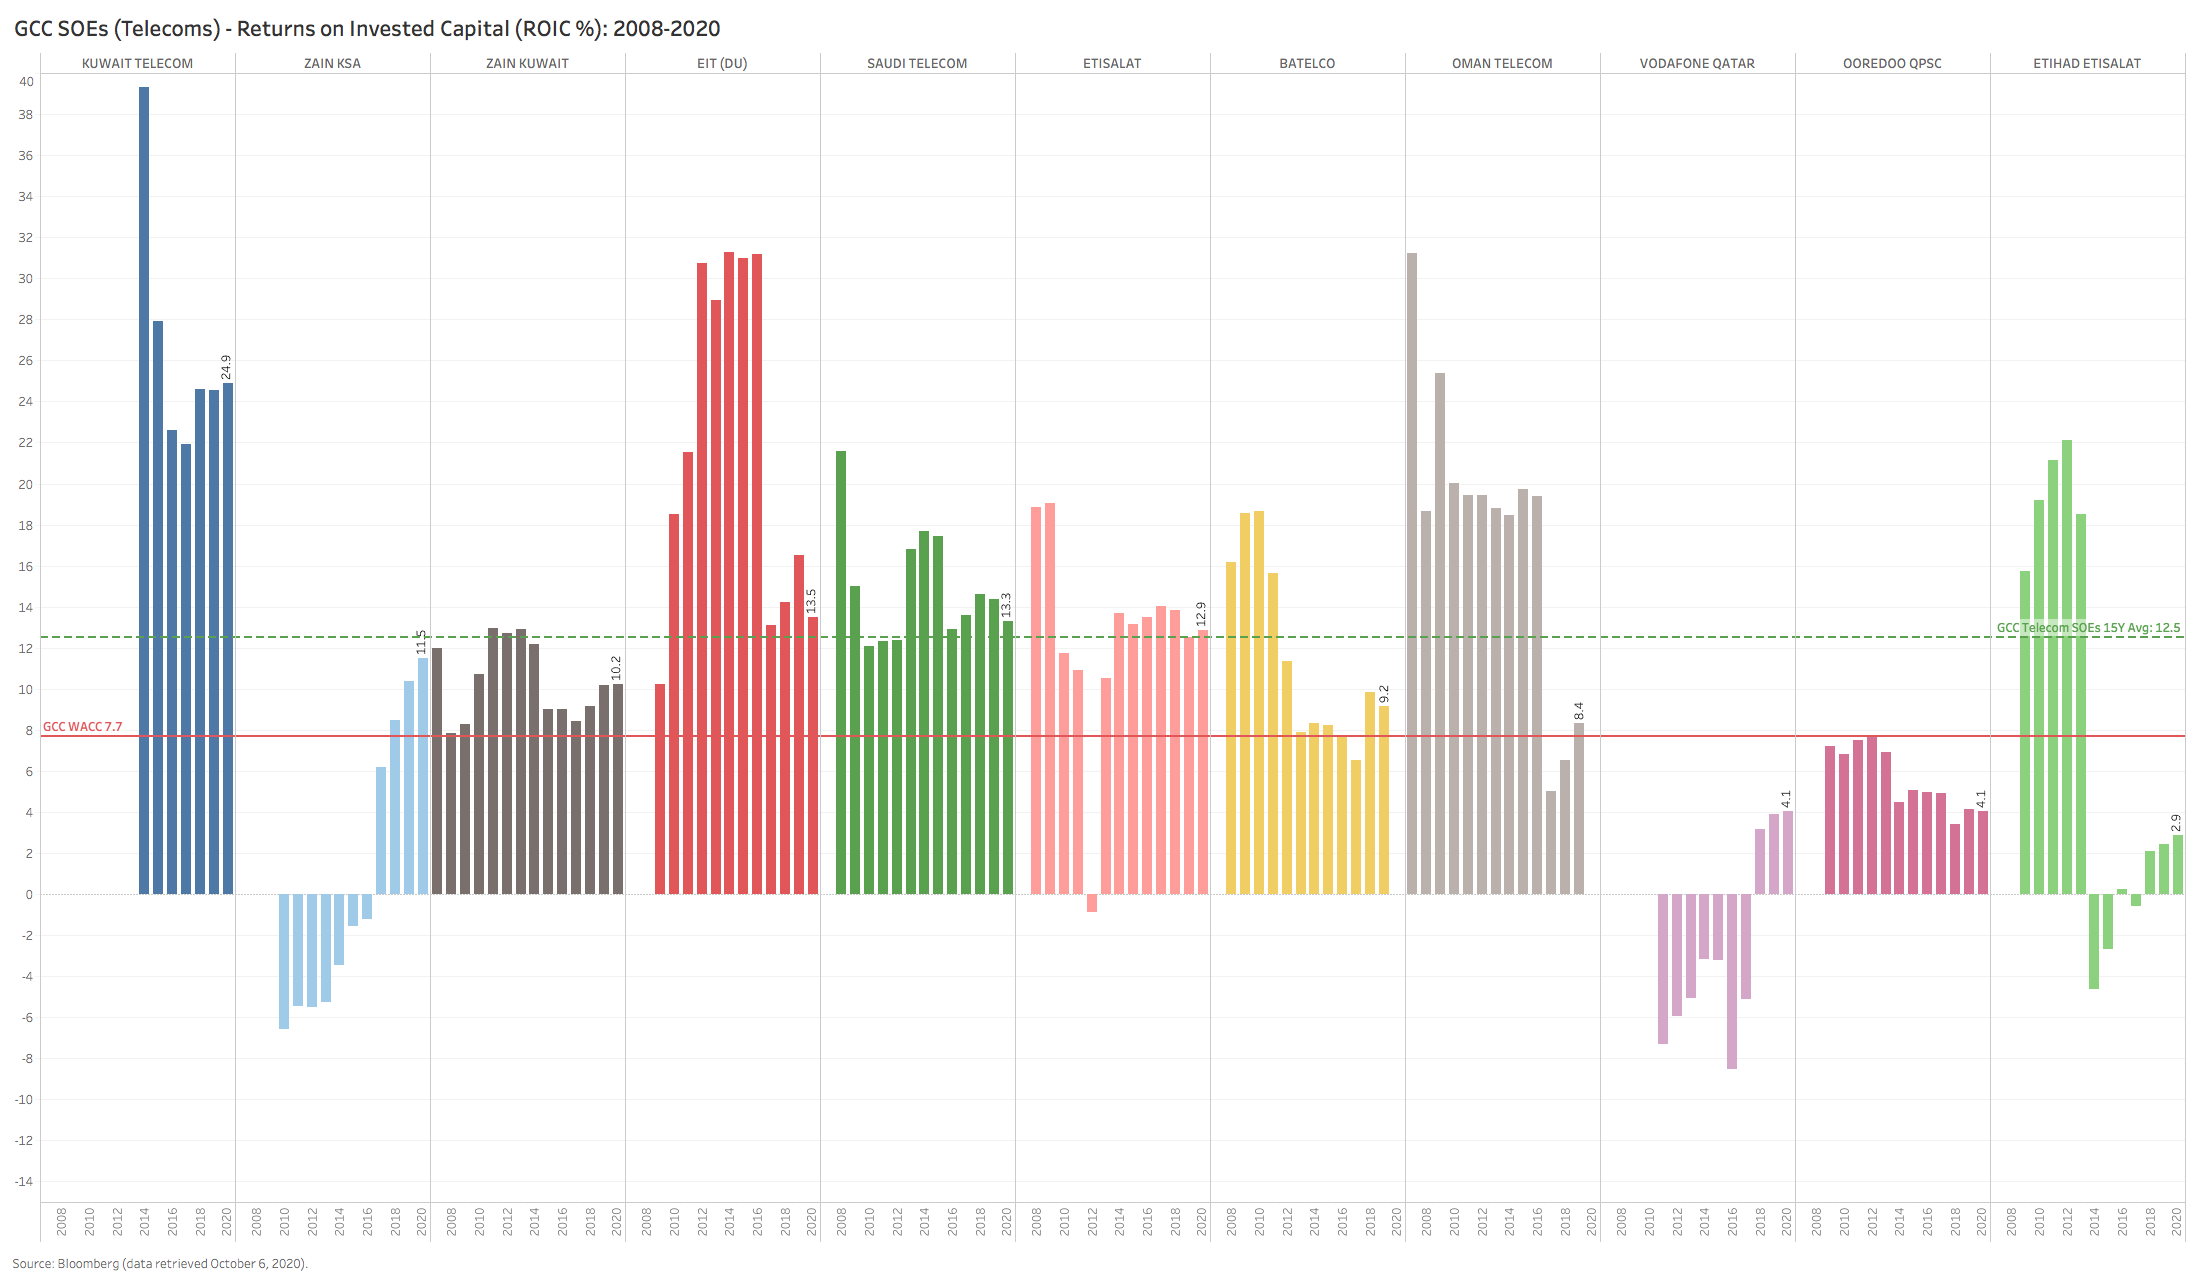
Chart 13: GCC SOE Sample (Banks) – ROEs (2008-2020)
On the other hand, the small number of private sector GCC companies are not only generating much higher aggregate returns on capital vs their SOE peers (Charts 14 & 15 below), but the recent trend in returns for many franchises is much more encouraging. Companies like Jarir, Aramex, United Electronics, Mouwasat, Al Othaim, Bupa, Al-Rajhi Bank and Bank Al-Bilad – all have shown incredible resilience in terms of their return profiles over the past 5 years. This is not a small feat, especially in light of how uneven the overall playing field is in their respective markets.
Chart 14: GCC Private Companies Sample (Banks) – ROEs (2008-2020)

Chart 15: GCC Private Companies Sample (Non-Financials) – ROICs (2008-2020)

