- GCC SOE Dominance: Misalignment of Incentives and Economic Value Destruction
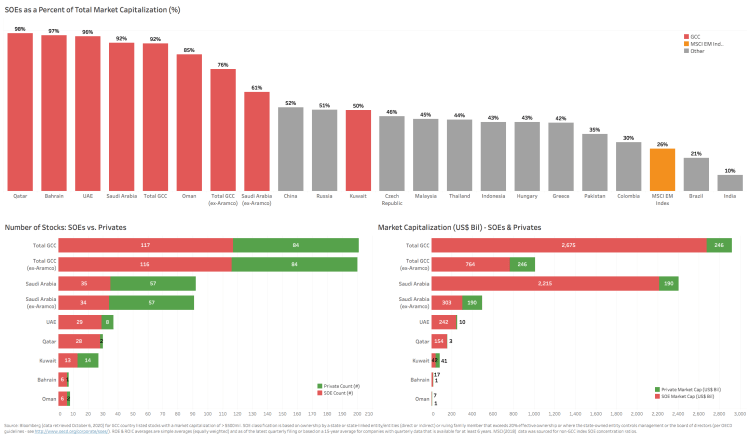 Looking at the current return on capital profiles for the GCC countries, a few things become abundantly clear: 1) overall GCC aggregate return on capital (7.5%) is now firmly below the blended cost of capital (7.7%), suggesting that based on the latest quarter performance, the GCC in aggregate is generating negative economic value-added, 2) with the lone exception of Kuwait, all individual market aggregate ROCs are below their cost of capital hurdle rates (Kuwait is an outlier in that less profitable SOE or sovereign-linked companies do not dominate the total market capitalization) and 3) this is despite very low corporateContinue reading “GCC SOE Dominance: Misalignment of Incentives and Economic Value Destruction”
 - Iraq – Tragedy to Catharsis?
 Note to Readers: For a better viewing of charts, please right click the chart image and open as a new window to view in full resolution. “Iraq reminds me of a classic Shakespearean tragedy – whenever you think things just can’t get any worse, the plot surprises you by taking yet another major step down.” George Soros (2007) “When I assumed responsibility, I found an almost empty treasury and an unenviable situation after 17 years of change. Our sovereignty continued to be deficient, violated and doubted. The past period did not see any [effort to] upgrade vital sectors as industry,Continue reading “Iraq – Tragedy to Catharsis?”
 - GCC – Hello Negative Operating Leverage – Can/Should GCC Pegs Persist?
 The last few times GCC pegged currencies like the Saudi Arabian Riyal (SAR) were this dislocated, they were ‘saved’ by a reversal in oil prices or the US$ (or both). Time will tell if history repeats itself. One thing is for sure though – the current environment is not a great cocktail for the SAR/$ peg (or any of the other GCC pegs for that matter). Proponents for keeping the peg will rant off the same templated rationale we’ve been hearing for years: 1) Saudi really only exports one thing – US$-priced & hydrocarbon-derived energy (whether in the form of oilContinue reading “GCC – Hello Negative Operating Leverage – Can/Should GCC Pegs Persist?”
 - Density, Openness and Infrastructure – Emerging Market Urban City Vulnerabilities
 A ranking of population densities of major urban cities worldwide (UN data for city centers with populations > 7 million) sheds some light on which major cities will need to urgently address some of the challenges of contagion presented by the ongoing COVID-19 pandemic. While most of the press focus has been mainly on developed country urban centers like New York & Paris, it is worth noting that the New York Metropolitan area (18.8 million pop, 11th largest city agglomeration) ranks only 55th globally in terms of population density of 1,800 persons/square kilometer. Densities are tricky though – since forContinue reading “Density, Openness and Infrastructure – Emerging Market Urban City Vulnerabilities”
 - If we viewed a country through the prism of a publicly listed company – would you invest in its stock?
 Note to Readers: For a better viewing of charts, please right click the chart image and open as a new window to view in full resolution. At Jadara Capital Partners, when investing across emerging and frontier markets, we spend as much time analyzing countries as we do analyzing sectors and companies. In emerging market investing, we believe the country risk premium tends to be a driving factor for long run investment returns (and alpha), so solving for the country risk/return metrics becomes an essential part of picking outperforming stocks that don’t get caught up in a bad macro environment. MuchContinue reading “If we viewed a country through the prism of a publicly listed company – would you invest in its stock?”
 - Ukraine – A Global Powerhouse Protein Exporter in the Making
 In a relatively short period (the last 10 years), Ukraine has begun to make its mark in the top rankings of major poultry exporters. The country, historically known as the ‘breadbasket of Europe’, with over a quarter of the world’s fertile chernozem soil (or “black earth”) and 54% of its land arable, has long dominated several grain and oil-seed export markets (4th ranked wheat exporter globally, 3rd ranked exporter of corn, top-ranked exporter of sunflower oil). In recent years the country has made tremendous strides in transforming this natural comparative advantage in agriculture into a value-added export through scaled production and exportContinue reading “Ukraine – A Global Powerhouse Protein Exporter in the Making”
 - Who will feed the world in the next decades? Part I
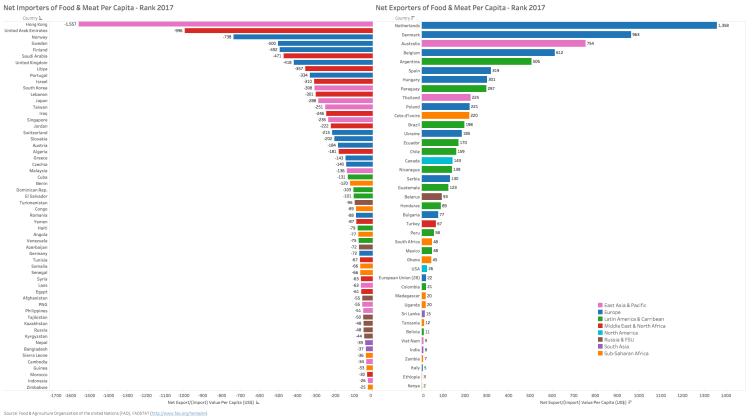
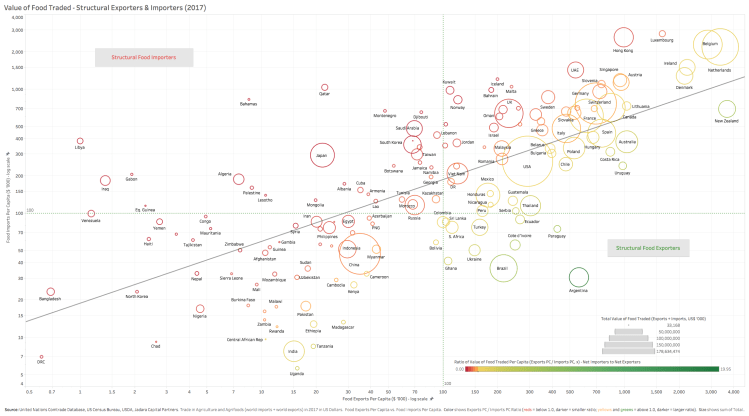 Looking at the sources and consumers of food by country from ’40k feet’, it is clear where the scalable and sustainable food supply will come from and where it is needed most. The first chart below segments countries by the ratio of the value of food & meat exports per capita relative to imports per capita (data from UNCTAD; size of each country bubble is the total size of the value of food trade (in US$s), the heat map corresponds to the intensity of the ratio of exports/imports – red=low exports/imports, green=high exports/imports). The second chart below takes the two extremeContinue reading “Who will feed the world in the next decades? Part I”
 - Who will feed the world in the next decades? Part II
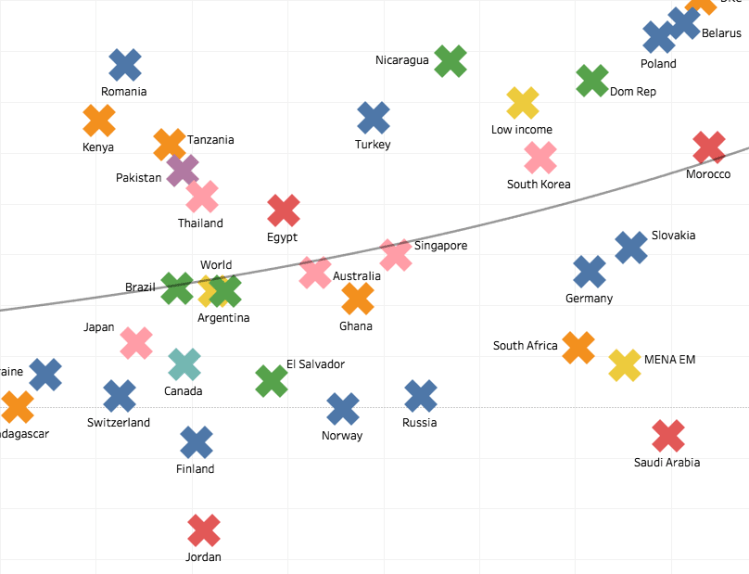
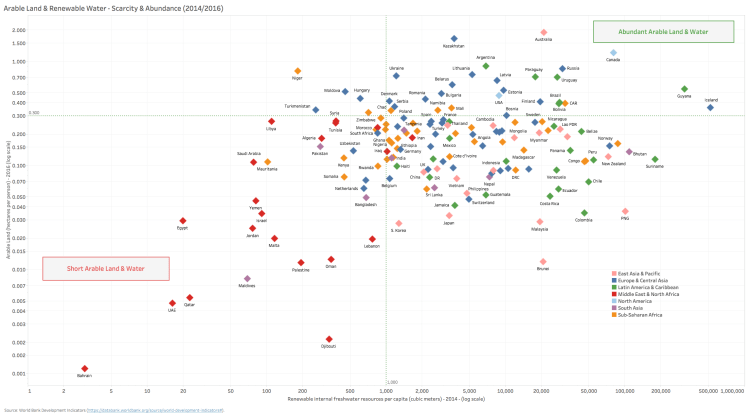 The ‘haves’ and the ‘have nots’ of #foodsecurity can also be classified by abundance (or scarcity) of the two essential inputs to farming and crop cultivation – arable land and renewable water resources. You either have them or you don’t . If we look at these vital resources in terms of per capita endowments, then the classification becomes abundantly clear. Here again, MENA countries (red) cluster almost exclusively in the ‘short’ quadrant (with the lone exception of Iran), while the ‘abundance’ quadrant is populated by the same large structural food exporters we highlighted in Part I (see: https://lnkd.in/dAwfXet). While land productivity is somethingContinue reading “Who will feed the world in the next decades? Part II”
 - Who will feed the world in the next decades? Part III
 Looking at the cross section of food consumption & production trends with global food trade reveals some interesting insights, particularly for the MENA region. 1. MENA countries dominate the list of top per capita wheat consumers globally (11 of the top 20), with several still growing consumption at far higher rates than the world average. Egypt is the world’s biggest net importer of wheat (aggregate tons of 12mil expected in 2020 by the USDA vs. 3.3mil for China), while KSA (the country turned from a modest exporter to a large net importer in the last decade) is the fastest growing wheat importerContinue reading “Who will feed the world in the next decades? Part III”
 - Aid, Rents, Remittances and Pegs – A Toxic Brew
 Here is a dangerous cocktail: a) chronic dependency on either foreign aid, inbound remittances or resource rents (or all of the above) and b) a dangerously overvalued exchange rate that is (in most cases) artificially pegged to the all-mighty, yet inflated US dollar. One of the not-so-obvious consequences of this toxic brew is an acceleration in capital flight or ‘offshoring’ of deposits (in terms of both aggregate stock of offshore deposits & their share relative to domestic deposits or GDP). We recently came across a World Bank report on offshore deposit trends amongst high foreign aid recipient countries in theContinue reading “Aid, Rents, Remittances and Pegs – A Toxic Brew”
Follow My Blog
Get new content delivered directly to your inbox.
